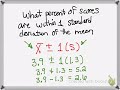
Calculating Percentages Within One Standard Deviation of the Mean
Interactive Video
•
Mathematics, Science, Other
•
9th - 10th Grade
•
Practice Problem
•
Hard

Patricia Brown
FREE Resource
Read more
6 questions
Show all answers
1.
MULTIPLE CHOICE QUESTION
30 sec • 1 pt
What is the main goal of the video tutorial?
To find the median of a dataset
To learn how to calculate the mean of a dataset
To understand how to create a dot plot
To determine the percentage of data within a certain standard deviation of the mean
2.
MULTIPLE CHOICE QUESTION
30 sec • 1 pt
What is the sample mean of the quiz scores mentioned in the video?
2.6
5.2
3.9
1.3
3.
MULTIPLE CHOICE QUESTION
30 sec • 1 pt
How do you calculate the range within one standard deviation of the mean?
Add and subtract the standard deviation from the mean
Multiply the mean by the standard deviation
Divide the mean by the standard deviation
Add the mean and standard deviation
4.
MULTIPLE CHOICE QUESTION
30 sec • 1 pt
What is the lower bound of the range within one standard deviation of the mean?
2.6
5.2
3.9
1.3
5.
MULTIPLE CHOICE QUESTION
30 sec • 1 pt
How many quiz scores fall within one standard deviation of the mean?
7
10
5
14
6.
MULTIPLE CHOICE QUESTION
30 sec • 1 pt
What percentage of the quiz scores are within one standard deviation of the mean?
71%
50%
100%
85%
Access all questions and much more by creating a free account
Create resources
Host any resource
Get auto-graded reports
Continue with Google

Continue with Email
Continue with Classlink
Continue with Clever
or continue with
Microsoft
%20(1).png)
Apple
Others
Already have an account?
