Understanding the Relative Strength Index (RSI)
Interactive Video
•
Business
•
9th - 12th Grade
•
Practice Problem
•
Hard

Sophia Harris
FREE Resource
Read more
10 questions
Show all answers
1.
MULTIPLE CHOICE QUESTION
30 sec • 1 pt
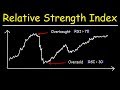
What does the RSI indicate when its value is below 30?
The stock is highly volatile
The stock is oversold
The stock is overbought
The stock is at a fair value
2.
MULTIPLE CHOICE QUESTION
30 sec • 1 pt
What does an RSI value above 70 typically suggest?
The stock is stable
The stock is undervalued
The stock is overbought
The stock is oversold
3.
MULTIPLE CHOICE QUESTION
30 sec • 1 pt
On a price chart, what do the lines at 30 and 70 represent in RSI?
Oversold and overbought conditions
Support and resistance levels
Entry and exit points
Market trend lines
4.
MULTIPLE CHOICE QUESTION
30 sec • 1 pt
Why is RSI not a reliable tool for making buy or sell decisions?
It only works for short-term trades
It is only applicable to certain stocks
It doesn't predict future price movements
It requires a subscription
5.
MULTIPLE CHOICE QUESTION
30 sec • 1 pt
What are the possible outcomes if you sell a stock based on RSI?
The stock price will definitely go up
The stock price could go down, sideways, or up
The stock price will remain unchanged
The stock price will definitely go down
6.
MULTIPLE CHOICE QUESTION
30 sec • 1 pt
How can RSI be useful as a stock screener?
By identifying stocks with high dividends
By finding stocks that have pulled back
By selecting stocks with low volatility
By choosing stocks with high trading volume
7.
MULTIPLE CHOICE QUESTION
30 sec • 1 pt
What is a potential risk when using RSI to screen for oversold stocks?
The stock will split
The stock will become illiquid
The stock will always increase in price
The stock may never recover
Access all questions and much more by creating a free account
Create resources
Host any resource
Get auto-graded reports
Continue with Google

Continue with Email
Continue with Classlink
Continue with Clever
or continue with
Microsoft
%20(1).png)
Apple
Others
Already have an account?
