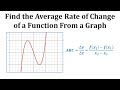
Calculating Average Rate of Change Using Graphs and Coordinates
Interactive Video
•
Mathematics
•
9th - 10th Grade
•
Practice Problem
•
Hard

Patricia Brown
FREE Resource
Read more
10 questions
Show all answers
1.
MULTIPLE CHOICE QUESTION
30 sec • 1 pt
What is the first step in determining the average rate of change of a function?
Find the slope of the tangent line
Identify the coordinates of the points
Calculate the derivative
Integrate the function
2.
MULTIPLE CHOICE QUESTION
30 sec • 1 pt
What are the coordinates of the point when X = 0?
(0, 9)
(0, 0)
(0, 6)
(0, 21)
3.
MULTIPLE CHOICE QUESTION
30 sec • 1 pt
How do you calculate the average rate of change from X = 0 to X = 1?
Add the X values and multiply by the difference in Y values
Subtract the Y values and divide by the difference in X values
Add the Y values and multiply by the difference in X values
Subtract the X values and divide by the difference in Y values
4.
MULTIPLE CHOICE QUESTION
30 sec • 1 pt
What does an average rate of change of 3 over 1 indicate?
The function value increases by 3 units for every 1 increase in X
The function value decreases by 1 unit for every 3 increase in X
The function value decreases by 3 units for every 1 increase in X
The function value remains constant
5.
MULTIPLE CHOICE QUESTION
30 sec • 1 pt
What is the average rate of change from X = 0 to X = 1?
3
2
4
1
6.
MULTIPLE CHOICE QUESTION
30 sec • 1 pt
What is the average rate of change from X = 2 to X = 5?
3
4
5
6
7.
MULTIPLE CHOICE QUESTION
30 sec • 1 pt
How is the average rate of change from X = 2 to X = 5 interpreted?
The function value remains constant
The function value decreases by 1 unit for every 5 increase in X
The function value increases by 5 units for every 1 increase in X
The function value decreases by 5 units for every 1 increase in X
Access all questions and much more by creating a free account
Create resources
Host any resource
Get auto-graded reports
Continue with Google

Continue with Email
Continue with Classlink
Continue with Clever
or continue with
Microsoft
%20(1).png)
Apple
Others
Already have an account?
