Analyzing Radioactive Decay and Half-Life Calculations
Interactive Video
•
Physics, Science, Mathematics
•
9th - 10th Grade
•
Practice Problem
•
Hard

Patricia Brown
FREE Resource
Read more
10 questions
Show all answers
1.
MULTIPLE CHOICE QUESTION
30 sec • 1 pt
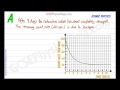
What does the vertical axis represent in the decay graph?
Time in days
Count rate in counts per minute
Background radiation
Half-life
2.
MULTIPLE CHOICE QUESTION
30 sec • 1 pt
Why does the count rate appear to stop decreasing after 8 days?
The isotope has reached a stable state
The count rate is now only background radiation
The detector is malfunctioning
The isotope has completely decayed
3.
MULTIPLE CHOICE QUESTION
30 sec • 1 pt
What is the background radiation count in this experiment?
40 counts per minute
30 counts per minute
20 counts per minute
10 counts per minute
4.
MULTIPLE CHOICE QUESTION
30 sec • 1 pt
Why is it important to subtract background radiation in radioactivity experiments?
To reduce the time of the experiment
To increase the count rate
To ensure accurate half-life calculations
To avoid using complex equipment
5.
MULTIPLE CHOICE QUESTION
30 sec • 1 pt
What is the first step in adjusting the data for half-life calculation?
Multiply the data by two
Subtract background radiation from the data
Add background radiation to the data
Divide the data by the count rate
6.
MULTIPLE CHOICE QUESTION
30 sec • 1 pt
What is the initial count rate after subtracting the background radiation?
60 counts per minute
100 counts per minute
40 counts per minute
80 counts per minute
7.
MULTIPLE CHOICE QUESTION
30 sec • 1 pt
How long does it take for the count rate to decrease from 80 to 40 counts per minute?
3 hours
2 hours
1 hour
30 minutes
Access all questions and much more by creating a free account
Create resources
Host any resource
Get auto-graded reports
Continue with Google

Continue with Email
Continue with Classlink
Continue with Clever
or continue with
Microsoft
%20(1).png)
Apple
Others
Already have an account?
