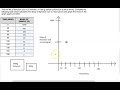
Modeling Half-Life Graphs Using Francium-223 Data
Interactive Video
•
Mathematics, Physics, Science
•
9th - 10th Grade
•
Practice Problem
•
Hard

Patricia Brown
FREE Resource
Read more
10 questions
Show all answers
1.
MULTIPLE CHOICE QUESTION
30 sec • 1 pt
What is the half-life of francium-223 as mentioned in the video?
10 minutes
40 minutes
20 minutes
30 minutes
2.
MULTIPLE CHOICE QUESTION
30 sec • 1 pt
After how many minutes will the mass of francium-223 be reduced to 250g?
80 minutes
60 minutes
40 minutes
20 minutes
3.
MULTIPLE CHOICE QUESTION
30 sec • 1 pt
What is the initial mass of francium-223 used in the example?
1250g
500g
750g
1000g
4.
MULTIPLE CHOICE QUESTION
30 sec • 1 pt
Which axis is used to represent time on the graph?
w-axis
z-axis
y-axis
x-axis
5.
MULTIPLE CHOICE QUESTION
30 sec • 1 pt
What unit is used for measuring time on the graph?
Hours
Minutes
Seconds
Days
6.
MULTIPLE CHOICE QUESTION
30 sec • 1 pt
What is the maximum value labeled on the y-axis for the mass of francium?
500g
1250g
750g
1000g
7.
MULTIPLE CHOICE QUESTION
30 sec • 1 pt
What number pattern is used to label the x-axis?
Counting in 30s
Counting in 20s
Counting in 10s
Counting in 40s
Access all questions and much more by creating a free account
Create resources
Host any resource
Get auto-graded reports
Continue with Google

Continue with Email
Continue with Classlink
Continue with Clever
or continue with
Microsoft
%20(1).png)
Apple
Others
Already have an account?
Similar Resources on Wayground

11 questions
Discrete vs Continuous: Key Concepts and Differences
Interactive video
•
8th - 12th Grade
6 questions
Part 2: The Early Catholic Church in Australia
Interactive video
•
9th Grade
6 questions
1.3 Life of a Roman Teenager
Interactive video
•
9th Grade
9 questions
Transformation of Function
Interactive video
•
9th - 12th Grade
Popular Resources on Wayground
15 questions
Fractions on a Number Line
Quiz
•
3rd Grade
10 questions
Probability Practice
Quiz
•
4th Grade
15 questions
Probability on Number LIne
Quiz
•
4th Grade
20 questions
Equivalent Fractions
Quiz
•
3rd Grade
25 questions
Multiplication Facts
Quiz
•
5th Grade
22 questions
fractions
Quiz
•
3rd Grade
6 questions
Appropriate Chromebook Usage
Lesson
•
7th Grade
10 questions
Greek Bases tele and phon
Quiz
•
6th - 8th Grade
Discover more resources for Mathematics
23 questions
TSI Math Vocabulary
Quiz
•
10th - 12th Grade
15 questions
Graphing Inequalities
Quiz
•
7th - 9th Grade
20 questions
Graphing Inequalities on a Number Line
Quiz
•
6th - 9th Grade
15 questions
Combine Like Terms and Distributive Property
Quiz
•
8th - 9th Grade
10 questions
Plotting Points on a Coordinate Plane: Quadrant 1 Essentials
Interactive video
•
6th - 10th Grade
20 questions
Perfect Squares and Square Roots
Quiz
•
9th Grade
10 questions
Exploring Abiotic and Biotic Factors in Ecosystems
Interactive video
•
6th - 10th Grade
20 questions
Function or Not a Function
Quiz
•
8th - 9th Grade