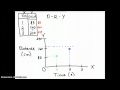
Distance and Time Relationship
Interactive Video
•
Mathematics, Physics, Science
•
6th - 7th Grade
•
Practice Problem
•
Hard

Patricia Brown
FREE Resource
Read more
10 questions
Show all answers
1.
MULTIPLE CHOICE QUESTION
30 sec • 1 pt
What is the distance traveled by the car in the first second?
83 centimeters
170 centimeters
210 centimeters
240 centimeters
2.
MULTIPLE CHOICE QUESTION
30 sec • 1 pt
Which variable is considered independent in this experiment?
Distance
Time
Speed
Acceleration
3.
MULTIPLE CHOICE QUESTION
30 sec • 1 pt
On which axis is the dependent variable plotted?
Y-axis
Z-axis
X-axis
None
4.
MULTIPLE CHOICE QUESTION
30 sec • 1 pt
What unit is used for the x-axis in the graph?
Minutes
Seconds
Centimeters
Meters
5.
MULTIPLE CHOICE QUESTION
30 sec • 1 pt
How should the increments on the y-axis be spaced?
Unevenly
Irregularly
Randomly
Evenly
6.
MULTIPLE CHOICE QUESTION
30 sec • 1 pt
What is the estimated distance traveled by the car in two seconds?
240 centimeters
210 centimeters
170 centimeters
83 centimeters
7.
MULTIPLE CHOICE QUESTION
30 sec • 1 pt
What tool is suggested for connecting the data points on the graph?
Calculator
Compass
Protractor
Ruler
Access all questions and much more by creating a free account
Create resources
Host any resource
Get auto-graded reports
Continue with Google

Continue with Email
Continue with Classlink
Continue with Clever
or continue with
Microsoft
%20(1).png)
Apple
Others
Already have an account?
