Interpreting Graphs and Temperature Changes
Interactive Video
•
Mathematics, Science, Physics
•
6th - 7th Grade
•
Practice Problem
•
Hard

Patricia Brown
FREE Resource
Read more
10 questions
Show all answers
1.
MULTIPLE CHOICE QUESTION
30 sec • 1 pt
What is the main reason the instructor uses different programs for solving practice tests?
To avoid using a calculator
To reduce video length
To make the video more interesting
To better illustrate questions with screen capture
2.
MULTIPLE CHOICE QUESTION
30 sec • 1 pt
What was Rayota's homework assignment about?
Measuring rainfall
Graphing wind speed
Calculating humidity levels
Measuring and graphing temperature
3.
MULTIPLE CHOICE QUESTION
30 sec • 1 pt
What does the instructor apologize for in the video?
The quality of the video
Using a calculator
The length of the video
Mispronouncing a name
4.
MULTIPLE CHOICE QUESTION
30 sec • 1 pt
When interpreting a graph, what should you first pay attention to?
The colors used
The size of the graph
The axes labels
The title of the graph
5.
MULTIPLE CHOICE QUESTION
30 sec • 1 pt
In the graph discussed, how does time progress?
From bottom to top
From top to bottom
From left to right
From right to left
6.
MULTIPLE CHOICE QUESTION
30 sec • 1 pt
What does a constant line on a graph indicate about temperature?
It remains the same
It is decreasing
It fluctuates
It is increasing
7.
MULTIPLE CHOICE QUESTION
30 sec • 1 pt
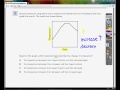
What pattern of temperature change is observed in the graph?
Decrease, constant, increase
Increase, constant, decrease
Constant, increase, decrease
Increase, decrease, constant
Access all questions and much more by creating a free account
Create resources
Host any resource
Get auto-graded reports
Continue with Google

Continue with Email
Continue with Classlink
Continue with Clever
or continue with
Microsoft
%20(1).png)
Apple
Others
Already have an account?
Popular Resources on Wayground

15 questions
Fractions on a Number Line
Quiz
•
3rd Grade
20 questions
Equivalent Fractions
Quiz
•
3rd Grade
25 questions
Multiplication Facts
Quiz
•
5th Grade
22 questions
fractions
Quiz
•
3rd Grade
20 questions
Main Idea and Details
Quiz
•
5th Grade
20 questions
Context Clues
Quiz
•
6th Grade
15 questions
Equivalent Fractions
Quiz
•
4th Grade
20 questions
Figurative Language Review
Quiz
•
6th Grade
Discover more resources for Mathematics
20 questions
Exponents
Quiz
•
6th Grade
22 questions
distributive property
Quiz
•
7th Grade
15 questions
Distributive Property & Review
Quiz
•
6th Grade
20 questions
Writing Algebraic Expressions
Quiz
•
6th Grade
20 questions
Ratios/Rates and Unit Rates
Quiz
•
6th Grade
20 questions
Writing and Graphing Inequalities
Quiz
•
6th Grade
10 questions
Unit Rate
Quiz
•
6th Grade
20 questions
Graphing Inequalities on a Number Line
Quiz
•
6th - 9th Grade