Graphing Techniques and Best Practices
Interactive Video
•
Mathematics, Physics, Science
•
6th - 8th Grade
•
Practice Problem
•
Hard

Patricia Brown
FREE Resource
Read more
10 questions
Show all answers
1.
MULTIPLE CHOICE QUESTION
30 sec • 1 pt
What does the 'T' in the TAILS mnemonic stand for?
Table
Time
Title
Trend
2.
MULTIPLE CHOICE QUESTION
30 sec • 1 pt
Why is it important to fill the graph page?
To make the graph look colorful
To make the graph look smaller
To save paper
To ensure the graph is easy to read
3.
MULTIPLE CHOICE QUESTION
30 sec • 1 pt
What should you avoid when plotting data points?
Using a ruler
Labeling the axes
Creating a straight line when not appropriate
Using different colors
4.
MULTIPLE CHOICE QUESTION
30 sec • 1 pt
What is crucial about the intervals on a graph?
They should be random
They should be equally spaced
They should be colorful
They should be labeled with letters
5.
MULTIPLE CHOICE QUESTION
30 sec • 1 pt
What is the benefit of having an independent scale?
It makes the graph easier to draw
It allows for more data points
It ensures accuracy in data representation
It makes the graph look more artistic
6.
MULTIPLE CHOICE QUESTION
30 sec • 1 pt
When plotting data, what should you do if the data points form a straight line?
Check if the intervals are equally spaced
Leave it as it is
Change the color of the line
Add more data points
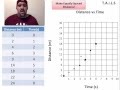
7.
MULTIPLE CHOICE QUESTION
30 sec • 1 pt
In the practical example, what was plotted on the x-axis?
Temperature
Distance
Speed
Time
Access all questions and much more by creating a free account
Create resources
Host any resource
Get auto-graded reports
Continue with Google

Continue with Email
Continue with Classlink
Continue with Clever
or continue with
Microsoft
%20(1).png)
Apple
Others
Already have an account?
Popular Resources on Wayground

15 questions
Fractions on a Number Line
Quiz
•
3rd Grade
10 questions
Probability Practice
Quiz
•
4th Grade
15 questions
Probability on Number LIne
Quiz
•
4th Grade
20 questions
Equivalent Fractions
Quiz
•
3rd Grade
25 questions
Multiplication Facts
Quiz
•
5th Grade
22 questions
fractions
Quiz
•
3rd Grade
6 questions
Appropriate Chromebook Usage
Lesson
•
7th Grade
10 questions
Greek Bases tele and phon
Quiz
•
6th - 8th Grade
Discover more resources for Mathematics
20 questions
Writing Algebraic Expressions
Quiz
•
6th Grade
20 questions
Ratios/Rates and Unit Rates
Quiz
•
6th Grade
14 questions
Volume of rectangular prisms
Quiz
•
7th Grade
15 questions
Graphing Inequalities
Quiz
•
7th - 9th Grade
20 questions
Graphing Inequalities on a Number Line
Quiz
•
6th - 9th Grade
20 questions
One Step Equations
Quiz
•
6th Grade
12 questions
One-Step Equations
Quiz
•
6th Grade
6 questions
Equations from models
Quiz
•
6th Grade