Understanding Distribution Shapes in Statistics
Interactive Video
•
Mathematics, Science, Other
•
9th - 10th Grade
•
Practice Problem
•
Hard

Patricia Brown
FREE Resource
Read more
10 questions
Show all answers
1.
MULTIPLE CHOICE QUESTION
30 sec • 1 pt
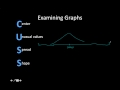
What does the acronym CUSS stand for in statistics?
Center, Unusual values, Spread, Shape
Center, Uniformity, Spread, Symmetry
Centrality, Uniqueness, Size, Shape
Core, Unusual values, Scale, Symmetry
2.
MULTIPLE CHOICE QUESTION
30 sec • 1 pt
In a normal distribution, where is the 'center' typically located?
At the lowest point of the curve
At the midpoint of the x-axis
At the tail of the curve
At the peak of the curve
3.
MULTIPLE CHOICE QUESTION
30 sec • 1 pt
What are unusual values in a distribution commonly referred to as?
Outliers
Medians
Modes
Averages
4.
MULTIPLE CHOICE QUESTION
30 sec • 1 pt
What can cause unusual values or outliers in a dataset?
Perfectly symmetrical data
Uniform data distribution
Consistent data entry
Errors in measurement or natural chance variation
5.
MULTIPLE CHOICE QUESTION
30 sec • 1 pt
How is the 'spread' of a distribution defined?
The most frequently occurring value
The range of values from smallest to largest
The average of all data points
The midpoint of the data set
6.
MULTIPLE CHOICE QUESTION
30 sec • 1 pt
Which of the following is NOT a type of distribution shape?
Uniform
Circular
Symmetric
Skewed
7.
MULTIPLE CHOICE QUESTION
30 sec • 1 pt
What does a symmetric distribution look like?
It has multiple peaks
It is a straight line
It has a longer tail on one side
It is the same on both sides
Access all questions and much more by creating a free account
Create resources
Host any resource
Get auto-graded reports
Continue with Google

Continue with Email
Continue with Classlink
Continue with Clever
or continue with
Microsoft
%20(1).png)
Apple
Others
Already have an account?
Similar Resources on Wayground
Popular Resources on Wayground

15 questions
Fractions on a Number Line
Quiz
•
3rd Grade
20 questions
Equivalent Fractions
Quiz
•
3rd Grade
25 questions
Multiplication Facts
Quiz
•
5th Grade
29 questions
Alg. 1 Section 5.1 Coordinate Plane
Quiz
•
9th Grade
22 questions
fractions
Quiz
•
3rd Grade
11 questions
FOREST Effective communication
Lesson
•
KG
20 questions
Main Idea and Details
Quiz
•
5th Grade
20 questions
Context Clues
Quiz
•
6th Grade
Discover more resources for Mathematics
29 questions
Alg. 1 Section 5.1 Coordinate Plane
Quiz
•
9th Grade
20 questions
Graphing Inequalities on a Number Line
Quiz
•
6th - 9th Grade
20 questions
Box and Whisker Plots
Quiz
•
9th Grade
18 questions
Exponential Growth and Decay
Quiz
•
9th Grade
20 questions
Function or Not a Function
Quiz
•
8th - 9th Grade
20 questions
SSS/SAS
Quiz
•
9th - 12th Grade
14 questions
Making Inferences From Samples
Quiz
•
7th - 12th Grade
23 questions
CCG - CH8 Polygon angles and area Review
Quiz
•
9th - 12th Grade