Solubility Curve Interpretation and Analysis
Interactive Video
•
Chemistry, Science, Physics
•
9th - 10th Grade
•
Practice Problem
•
Hard

Patricia Brown
FREE Resource
Read more
10 questions
Show all answers
1.
MULTIPLE CHOICE QUESTION
30 sec • 1 pt
What does the x-axis represent on a typical solubility graph?
The amount of solute in grams
The temperature in Celsius
The volume of solvent in liters
The pressure in atmospheres
2.
MULTIPLE CHOICE QUESTION
30 sec • 1 pt
On a solubility graph, what does the line represent?
The minimum amount of solute that can dissolve
The maximum amount of solute that can dissolve
The average amount of solute that can dissolve
The amount of solvent available
3.
MULTIPLE CHOICE QUESTION
30 sec • 1 pt
How do you find out how much solute can dissolve at 40 degrees Celsius?
Look at the y-axis directly
Estimate based on previous knowledge
Check the label on the graph
Go to 40 degrees on the x-axis, then up to the curve and across to the y-axis
4.
MULTIPLE CHOICE QUESTION
30 sec • 1 pt
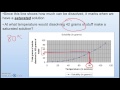
If you have 42 grams of solute, how do you determine the temperature for a saturated solution?
Start at 42 grams on the y-axis, move to the curve, then down to the x-axis
Start at 42 grams on the x-axis, move to the curve, then up to the y-axis
Estimate based on the graph's title
Use a calculator to find the temperature
5.
MULTIPLE CHOICE QUESTION
30 sec • 1 pt
What is the temperature at which 42 grams of solute will form a saturated solution?
80 degrees Celsius
60 degrees Celsius
90 degrees Celsius
70 degrees Celsius
6.
MULTIPLE CHOICE QUESTION
30 sec • 1 pt
How do you interpret a specific point on a solubility curve?
By reading the temperature and solute amount from the axes
By looking at the color of the curve
By estimating based on previous data
By checking the graph's title
7.
MULTIPLE CHOICE QUESTION
30 sec • 1 pt
What does the star symbol on the solubility curve represent?
The maximum solubility point
The average solubility of all solutes
A specific solubility point for a solute
A random point on the graph
Access all questions and much more by creating a free account
Create resources
Host any resource
Get auto-graded reports
Continue with Google

Continue with Email
Continue with Classlink
Continue with Clever
or continue with
Microsoft
%20(1).png)
Apple
Others
Already have an account?
Popular Resources on Wayground

15 questions
Fractions on a Number Line
Quiz
•
3rd Grade
20 questions
Equivalent Fractions
Quiz
•
3rd Grade
25 questions
Multiplication Facts
Quiz
•
5th Grade
29 questions
Alg. 1 Section 5.1 Coordinate Plane
Quiz
•
9th Grade
22 questions
fractions
Quiz
•
3rd Grade
11 questions
FOREST Effective communication
Lesson
•
KG
20 questions
Main Idea and Details
Quiz
•
5th Grade
20 questions
Context Clues
Quiz
•
6th Grade
Discover more resources for Chemistry
22 questions
Unit 9 Gas Law Quiz
Quiz
•
10th Grade
10 questions
Exploring Types of Chemical Reactions
Interactive video
•
6th - 10th Grade
20 questions
Types of Chemical Reactions
Quiz
•
9th - 12th Grade
20 questions
Acids and Bases
Quiz
•
10th Grade
30 questions
Energy Review
Quiz
•
9th Grade
7 questions
GCSE Chemistry - Balancing Chemical Equations #4
Interactive video
•
9th - 10th Grade
20 questions
Chemistry: Classification of Matter
Quiz
•
10th Grade
40 questions
Unit 3 (Part 1) Chemical Equations & Reactions Review Game
Quiz
•
8th - 12th Grade