Understanding Tide Charts and Tides
Interactive Video
•
Science, Geography, Other
•
6th - 7th Grade
•
Practice Problem
•
Hard

Patricia Brown
FREE Resource
Read more
10 questions
Show all answers
1.
MULTIPLE CHOICE QUESTION
30 sec • 1 pt
What is the main focus of the video tutorial?
How tides work
Beach activities
How to read a tide chart
Weather forecasting
2.
MULTIPLE CHOICE QUESTION
30 sec • 1 pt
What should viewers do if they haven't watched the 'how tides work' video?
Ignore it
Watch it for better understanding
Skip to the end of the current video
Read a book instead
3.
MULTIPLE CHOICE QUESTION
30 sec • 1 pt
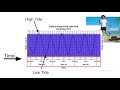
What does the wavy line on the tide chart represent?
Temperature changes
Water level
Wind speed
Sunrise and sunset times
4.
MULTIPLE CHOICE QUESTION
30 sec • 1 pt
How is time represented on the tide chart?
In 12-hour intervals
In 24-hour intervals
In 6-hour intervals
In 2-hour intervals
5.
MULTIPLE CHOICE QUESTION
30 sec • 1 pt
What is the significance of the zero line on the tide chart?
It represents the time of day
It represents the average sea level
It represents the lowest tide
It represents the highest tide
6.
MULTIPLE CHOICE QUESTION
30 sec • 1 pt
What does a high tide indicate on the chart?
Low water level
No change in water level
High water level
Average water level
7.
MULTIPLE CHOICE QUESTION
30 sec • 1 pt
How often do the tides cycle according to the video?
Every 18 hours
Every 6 hours
Every 24 hours
Every 12 hours
Access all questions and much more by creating a free account
Create resources
Host any resource
Get auto-graded reports
Continue with Google

Continue with Email
Continue with Classlink
Continue with Clever
or continue with
Microsoft
%20(1).png)
Apple
Others
Already have an account?
