Direct Proportionality and Graph Interpretation
Interactive Video
•
Mathematics, Physics, Science
•
6th - 7th Grade
•
Practice Problem
•
Hard

Patricia Brown
FREE Resource
Read more
10 questions
Show all answers
1.
MULTIPLE CHOICE QUESTION
30 sec • 1 pt
What does it mean when two variables are directly proportional?
One variable increases while the other decreases.
Both variables increase at the same rate.
Both variables decrease at different rates.
One variable remains constant while the other changes.
2.
MULTIPLE CHOICE QUESTION
30 sec • 1 pt
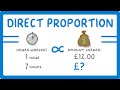
In the example of hours worked and money earned, what does the proportional symbol indicate?
The variables are inversely proportional.
The variables are directly proportional.
The variables are unrelated.
The variables are constant.
3.
MULTIPLE CHOICE QUESTION
30 sec • 1 pt
If you work 5 hours and earn 60 pounds, how much would you earn for 10 hours?
80 pounds
60 pounds
100 pounds
120 pounds
4.
MULTIPLE CHOICE QUESTION
30 sec • 1 pt
What is a key feature of a graph representing direct proportionality?
It is a horizontal line.
It has multiple peaks.
It passes through the origin.
It is a curved line.
5.
MULTIPLE CHOICE QUESTION
30 sec • 1 pt
On a graph of direct proportionality, what does the point (0,0) represent?
The point where the line ends.
The point where both variables are zero.
The starting point of the variables.
The maximum value of the variables.
6.
MULTIPLE CHOICE QUESTION
30 sec • 1 pt
How can you determine earnings for a specific number of hours using a graph?
By drawing a diagonal line from the origin.
By drawing a line parallel to the y-axis.
By drawing a vertical line from the x-axis.
By drawing a horizontal line from the x-axis.
7.
MULTIPLE CHOICE QUESTION
30 sec • 1 pt
If you worked 3.5 hours, how much would you earn according to the graph?
30 pounds
42 pounds
35 pounds
50 pounds
Access all questions and much more by creating a free account
Create resources
Host any resource
Get auto-graded reports
Continue with Google

Continue with Email
Continue with Classlink
Continue with Clever
or continue with
Microsoft
%20(1).png)
Apple
Others
Already have an account?
Popular Resources on Wayground

15 questions
Fractions on a Number Line
Quiz
•
3rd Grade
20 questions
Equivalent Fractions
Quiz
•
3rd Grade
25 questions
Multiplication Facts
Quiz
•
5th Grade
22 questions
fractions
Quiz
•
3rd Grade
20 questions
Main Idea and Details
Quiz
•
5th Grade
20 questions
Context Clues
Quiz
•
6th Grade
15 questions
Equivalent Fractions
Quiz
•
4th Grade
20 questions
Figurative Language Review
Quiz
•
6th Grade
Discover more resources for Mathematics
20 questions
Exponents
Quiz
•
6th Grade
22 questions
distributive property
Quiz
•
7th Grade
15 questions
Distributive Property & Review
Quiz
•
6th Grade
20 questions
Writing Algebraic Expressions
Quiz
•
6th Grade
20 questions
Ratios/Rates and Unit Rates
Quiz
•
6th Grade
20 questions
Writing and Graphing Inequalities
Quiz
•
6th Grade
10 questions
Unit Rate
Quiz
•
6th Grade
20 questions
Graphing Inequalities on a Number Line
Quiz
•
6th - 9th Grade