Understanding Data Set Statistics
Interactive Video
•
Mathematics, Science, Other
•
6th - 8th Grade
•
Practice Problem
•
Hard

Patricia Brown
FREE Resource
Read more
10 questions
Show all answers
1.
MULTIPLE CHOICE QUESTION
30 sec • 1 pt
What is a histogram used for?
To show the frequency of data in intervals
To display individual data points
To calculate the mean of a data set
To find the median of a data set
2.
MULTIPLE CHOICE QUESTION
30 sec • 1 pt
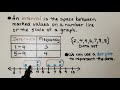
What defines an interval in a data set?
The highest value in the data set
The total number of data points
The space between marked values on a number line
The average of all data points
3.
MULTIPLE CHOICE QUESTION
30 sec • 1 pt
How many values are in the interval from 1 to 4 in the given example?
Two
Five
Three
Four
4.
MULTIPLE CHOICE QUESTION
30 sec • 1 pt
What is the mean of the student scores in the example?
92
93
91
90
5.
MULTIPLE CHOICE QUESTION
30 sec • 1 pt
How is the median of a data set determined?
By finding the average of all data points
By calculating the sum of all data points
By identifying the middle number in an ordered data set
By subtracting the smallest value from the largest
6.
MULTIPLE CHOICE QUESTION
30 sec • 1 pt
What is the range of the student scores in the example?
16
18
20
22
7.
MULTIPLE CHOICE QUESTION
30 sec • 1 pt
What does the interquartile range (IQR) represent?
The difference between the upper and lower quartiles
The average of the data set
The difference between the highest and lowest values
The sum of all data points
Access all questions and much more by creating a free account
Create resources
Host any resource
Get auto-graded reports
Continue with Google

Continue with Email
Continue with Classlink
Continue with Clever
or continue with
Microsoft
%20(1).png)
Apple
Others
Already have an account?
Popular Resources on Wayground

15 questions
Fractions on a Number Line
Quiz
•
3rd Grade
20 questions
Equivalent Fractions
Quiz
•
3rd Grade
25 questions
Multiplication Facts
Quiz
•
5th Grade
54 questions
Analyzing Line Graphs & Tables
Quiz
•
4th Grade
22 questions
fractions
Quiz
•
3rd Grade
20 questions
Main Idea and Details
Quiz
•
5th Grade
20 questions
Context Clues
Quiz
•
6th Grade
15 questions
Equivalent Fractions
Quiz
•
4th Grade
Discover more resources for Mathematics
22 questions
distributive property
Quiz
•
7th Grade
18 questions
Angle Relationships
Quiz
•
7th Grade
15 questions
Distributive Property & Review
Quiz
•
6th Grade
20 questions
Writing Algebraic Expressions
Quiz
•
6th Grade
20 questions
How Some Friendships Last — and Others Don’t Video Questions
Quiz
•
7th Grade
14 questions
finding slope from a graph
Quiz
•
8th Grade
20 questions
Ratios/Rates and Unit Rates
Quiz
•
6th Grade
18 questions
Handbook Refresher Quiz
Quiz
•
7th Grade