Chemical Reaction Rates and Graphs
Interactive Video
•
Chemistry, Mathematics, Science
•
9th - 12th Grade
•
Practice Problem
•
Hard

Patricia Brown
FREE Resource
Read more
10 questions
Show all answers
1.
MULTIPLE CHOICE QUESTION
30 sec • 1 pt
What is the average speed of a car that travels 100 kilometers in 2 hours?
25 km/h
75 km/h
50 km/h
100 km/h
2.
MULTIPLE CHOICE QUESTION
30 sec • 1 pt
In a chemical reaction, what happens to the rate of conversion as the concentration of reactants decreases?
It becomes zero
It decreases
It remains constant
It increases
3.
MULTIPLE CHOICE QUESTION
30 sec • 1 pt
How is the average rate of a chemical reaction calculated?
By dividing the change in concentration by the change in time
By multiplying the change in concentration by the change in time
By adding the initial and final concentrations
By subtracting the initial time from the final time
4.
MULTIPLE CHOICE QUESTION
30 sec • 1 pt
What is the average rate of disappearance of a reactant if its concentration changes from 2.5 M to 1 M in 10 minutes?
0.15 M/min
0.20 M/min
0.10 M/min
0.25 M/min
5.
MULTIPLE CHOICE QUESTION
30 sec • 1 pt
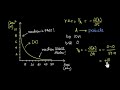
What is the purpose of drawing a tangent to a curve in a concentration vs. time graph?
To measure the final concentration
To find the average rate
To determine the instantaneous rate
To calculate the total reaction time
6.
MULTIPLE CHOICE QUESTION
30 sec • 1 pt
How do you calculate the instantaneous rate at a specific time?
By finding the slope of the tangent at that point
By measuring the total change in concentration
By averaging the initial and final rates
By dividing the total concentration by time
7.
MULTIPLE CHOICE QUESTION
30 sec • 1 pt
What does a steeper slope in a concentration vs. time graph indicate?
A slower reaction rate
No reaction occurring
A constant reaction rate
A faster reaction rate
Access all questions and much more by creating a free account
Create resources
Host any resource
Get auto-graded reports
Continue with Google

Continue with Email
Continue with Classlink
Continue with Clever
or continue with
Microsoft
%20(1).png)
Apple
Others
Already have an account?
