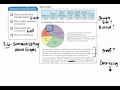
Graph Interpretation and Communication
Interactive Video
•
Mathematics, English, Other
•
6th - 8th Grade
•
Practice Problem
•
Hard

Patricia Brown
FREE Resource
Read more
10 questions
Show all answers
1.
MULTIPLE CHOICE QUESTION
30 sec • 1 pt
What is the main focus of Chapter 3.6?
Understanding different types of graphs
Analyzing historical data trends
Communicating effectively using graphs
Learning about data collection methods
2.
MULTIPLE CHOICE QUESTION
30 sec • 1 pt
Which graph did Kayle choose to represent spending and saving habits?
Bar graph
Histogram
Line graph
Circle graph
3.
MULTIPLE CHOICE QUESTION
30 sec • 1 pt
What was a major flaw in Kayle's report?
She used a line graph instead of a circle graph
She surveyed too many people
She did not mention the sample size
She used a scatter plot
4.
MULTIPLE CHOICE QUESTION
30 sec • 1 pt
Why was the sample size in Kayle's report questioned?
It was too large
It was not representative of all 13-year-olds
It included only adults
It was not clearly defined
5.
MULTIPLE CHOICE QUESTION
30 sec • 1 pt
What type of graph did Rohan use for his survey?
Histogram
Line graph
Pictograph
Circle graph
6.
MULTIPLE CHOICE QUESTION
30 sec • 1 pt
What conclusion did Rohan draw from his histogram?
Music is not important to 13-year-olds
Students prefer reading over music
Most students listen to music for less than 10 hours a week
Music is very important to 13-year-olds
7.
MULTIPLE CHOICE QUESTION
30 sec • 1 pt
What could have made Rohan's argument more convincing?
Using a circle graph
Conducting a comparison study with other age groups
Using a scatter plot
Including more data points
Access all questions and much more by creating a free account
Create resources
Host any resource
Get auto-graded reports
Continue with Google

Continue with Email
Continue with Microsoft
or continue with

%20(1).png)
Apple
Others
Already have an account?
