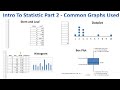
Data Representation Techniques in Statistics
Interactive Video
•
Mathematics, Science, Other
•
6th - 8th Grade
•
Practice Problem
•
Hard

Patricia Brown
FREE Resource
Read more
10 questions
Show all answers
1.
MULTIPLE CHOICE QUESTION
30 sec • 1 pt
What is the primary purpose of a stem-and-leaf plot?
To display the distribution of data points
To find the mode of a dataset
To calculate the mean of a dataset
To compare two different datasets
2.
MULTIPLE CHOICE QUESTION
30 sec • 1 pt
In a stem-and-leaf plot, what does the 'stem' represent?
The units digit
The tens digit
The hundreds digit
The thousands digit
3.
MULTIPLE CHOICE QUESTION
30 sec • 1 pt
How is a dot plot constructed?
By connecting points with lines
By plotting dots above a number line
By using bars to represent frequency
By using pie slices to show proportions
4.
MULTIPLE CHOICE QUESTION
30 sec • 1 pt
What does each dot in a dot plot represent?
The frequency of a specific value
The total number of data points
The average of the dataset
A unique data point
5.
MULTIPLE CHOICE QUESTION
30 sec • 1 pt
What is the main feature of a histogram?
It shows data distribution over intervals
It uses lines to connect data points
It uses dots to represent data
It displays data in a circular format
6.
MULTIPLE CHOICE QUESTION
30 sec • 1 pt
In a histogram, what does the height of each bar represent?
The sum of the data points
The range of the data
The frequency of data within an interval
The median of the dataset
7.
MULTIPLE CHOICE QUESTION
30 sec • 1 pt
What does the box in a box plot represent?
The range of the dataset
The interquartile range
The mean of the dataset
The total number of data points
Access all questions and much more by creating a free account
Create resources
Host any resource
Get auto-graded reports
Continue with Google

Continue with Email
Continue with Classlink
Continue with Clever
or continue with
Microsoft
%20(1).png)
Apple
Others
Already have an account?
Popular Resources on Wayground

15 questions
Fractions on a Number Line
Quiz
•
3rd Grade
20 questions
Equivalent Fractions
Quiz
•
3rd Grade
25 questions
Multiplication Facts
Quiz
•
5th Grade
54 questions
Analyzing Line Graphs & Tables
Quiz
•
4th Grade
22 questions
fractions
Quiz
•
3rd Grade
20 questions
Main Idea and Details
Quiz
•
5th Grade
20 questions
Context Clues
Quiz
•
6th Grade
15 questions
Equivalent Fractions
Quiz
•
4th Grade
Discover more resources for Mathematics
22 questions
distributive property
Quiz
•
7th Grade
18 questions
Angle Relationships
Quiz
•
7th Grade
15 questions
Distributive Property & Review
Quiz
•
6th Grade
20 questions
Writing Algebraic Expressions
Quiz
•
6th Grade
20 questions
How Some Friendships Last — and Others Don’t Video Questions
Quiz
•
7th Grade
14 questions
finding slope from a graph
Quiz
•
8th Grade
20 questions
Ratios/Rates and Unit Rates
Quiz
•
6th Grade
18 questions
Handbook Refresher Quiz
Quiz
•
7th Grade