Understanding Position-Time and Velocity-Time Graphs
Interactive Video
•
Physics
•
9th - 10th Grade
•
Practice Problem
•
Hard

Patricia Brown
FREE Resource
Read more
10 questions
Show all answers
1.
MULTIPLE CHOICE QUESTION
30 sec • 1 pt
What does a constant positive slope on a position-time graph indicate about an object's motion?
The object is stationary.
The object is moving with constant positive velocity.
The object is accelerating.
The object is moving with constant negative velocity.
2.
MULTIPLE CHOICE QUESTION
30 sec • 1 pt
How can you determine the instantaneous velocity of an object on a curved position-time graph?
By calculating the average slope of the curve.
By measuring the area under the curve.
By counting the number of peaks on the curve.
By finding the slope of the tangent line at a specific point.
3.
MULTIPLE CHOICE QUESTION
30 sec • 1 pt
What does a flat line on a position-time graph signify about an object's motion?
The object is moving with variable velocity.
The object is accelerating.
The object is moving with constant velocity.
The object is not moving.
4.
MULTIPLE CHOICE QUESTION
30 sec • 1 pt
If an object has a negative velocity on a position-time graph, what does this mean?
The object is moving backward.
The object is moving forward.
The object is accelerating.
The object is stationary.
5.
MULTIPLE CHOICE QUESTION
30 sec • 1 pt
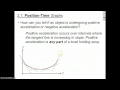
How can you identify positive acceleration on a position-time graph?
The curve is flat.
The curve is a straight line.
The curve forms a bowl shape.
The curve forms an upside-down bowl.
6.
MULTIPLE CHOICE QUESTION
30 sec • 1 pt
What does a VT graph's x-axis represent?
The position of the object.
The reference point.
The acceleration of the object.
Velocity equal to 0 m/s.
7.
MULTIPLE CHOICE QUESTION
30 sec • 1 pt
On a VT graph, what does a flat line above the x-axis indicate?
The object is moving with constant negative velocity.
The object is moving with constant positive velocity.
The object is accelerating.
The object is stationary.
Access all questions and much more by creating a free account
Create resources
Host any resource
Get auto-graded reports
Continue with Google

Continue with Email
Continue with Classlink
Continue with Clever
or continue with
Microsoft
%20(1).png)
Apple
Others
Already have an account?
Similar Resources on Wayground

6 questions
CLEAN : Hajj: Muslim pilgrims say they are against Islamic State group
Interactive video
•
9th - 10th Grade
11 questions
Polynomial Roots and Quadratic Solutions
Interactive video
•
9th - 10th Grade
11 questions
Understanding Continuous vs Discrete Models
Interactive video
•
9th - 10th Grade
11 questions
Wave Properties and Behavior
Interactive video
•
9th - 10th Grade
11 questions
Velocity-Time Graph Concepts
Interactive video
•
9th - 10th Grade
8 questions
A Practical Approach to Timeseries Forecasting Using Python - Time Series Parameters
Interactive video
•
9th - 10th Grade
6 questions
Time Running Out Until Old GBP Coins No Longer Leg
Interactive video
•
9th - 10th Grade
6 questions
CLEAN : Ukraine rebels hand over MH17 black boxes
Interactive video
•
9th - 10th Grade
Popular Resources on Wayground
8 questions
Spartan Way - Classroom Responsible
Quiz
•
9th - 12th Grade
15 questions
Fractions on a Number Line
Quiz
•
3rd Grade
14 questions
Boundaries & Healthy Relationships
Lesson
•
6th - 8th Grade
20 questions
Equivalent Fractions
Quiz
•
3rd Grade
3 questions
Integrity and Your Health
Lesson
•
6th - 8th Grade
25 questions
Multiplication Facts
Quiz
•
5th Grade
9 questions
FOREST Perception
Lesson
•
KG
20 questions
Main Idea and Details
Quiz
•
5th Grade
Discover more resources for Physics
10 questions
Exit Check 4.5 - Impulse
Quiz
•
9th Grade
20 questions
Simple Machines and Mechanical Advantage Quiz
Quiz
•
9th Grade
20 questions
Electricity/Magnets
Quiz
•
9th Grade
20 questions
Light Vs. Sound Waves
Quiz
•
9th - 12th Grade
14 questions
Bill Nye Waves
Interactive video
•
9th - 12th Grade
37 questions
CIA #3 Study Guide: ACPS
Quiz
•
10th Grade
20 questions
Waves
Quiz
•
9th - 12th Grade
10 questions
Exploring the Properties of Waves
Interactive video
•
9th - 12th Grade