Normal Distribution and Sample Proportions
Interactive Video
•
Mathematics, Science, Other
•
9th - 10th Grade
•
Practice Problem
•
Hard

Patricia Brown
FREE Resource
Read more
10 questions
Show all answers
1.
MULTIPLE CHOICE QUESTION
30 sec • 1 pt
Why is it impractical to measure the proportion of left-handed people in the entire population?
Because it is illegal to measure such traits.
Because left-handedness changes over time.
Because the population is too large to measure everyone.
Because left-handed people are rare.
2.
MULTIPLE CHOICE QUESTION
30 sec • 1 pt
How do you calculate the sample proportion from a sample?
By multiplying the number of left-handed people by the sample size.
By adding the number of left-handed people to the sample size.
By dividing the total population by the sample size.
By dividing the number of left-handed people by the sample size.
3.
MULTIPLE CHOICE QUESTION
30 sec • 1 pt
What is the sample proportion if 75 out of 500 people are left-handed?
0.25
0.50
0.15
0.075
4.
MULTIPLE CHOICE QUESTION
30 sec • 1 pt
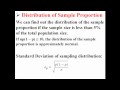
Under what condition is the distribution of the sample proportion approximately normal?
When n * p * (1-p) is less than 10.
When n * p * (1-p) is greater than 10.
When the sample size is less than 5% of the population.
When the sample size is more than 10% of the population.
5.
MULTIPLE CHOICE QUESTION
30 sec • 1 pt
What does the equation n * p * (1-p) > 10 indicate about the sample proportion distribution?
It is bimodal.
It is uniform.
It is approximately normal.
It is skewed.
6.
MULTIPLE CHOICE QUESTION
30 sec • 1 pt
How is the standard deviation of a sampling distribution calculated?
By using a specific equation involving n and p.
By using the equation n * p * (1-p).
By dividing the sample size by the population size.
By subtracting the mean from the sample size.
7.
MULTIPLE CHOICE QUESTION
30 sec • 1 pt
What is the standard deviation if n is 500 and p is 0.15?
0.016
0.015
0.018
0.017
Access all questions and much more by creating a free account
Create resources
Host any resource
Get auto-graded reports
Continue with Google

Continue with Email
Continue with Classlink
Continue with Clever
or continue with
Microsoft
%20(1).png)
Apple
Others
Already have an account?
Popular Resources on Wayground

7 questions
History of Valentine's Day
Interactive video
•
4th Grade
15 questions
Fractions on a Number Line
Quiz
•
3rd Grade
20 questions
Equivalent Fractions
Quiz
•
3rd Grade
25 questions
Multiplication Facts
Quiz
•
5th Grade
22 questions
fractions
Quiz
•
3rd Grade
15 questions
Valentine's Day Trivia
Quiz
•
3rd Grade
20 questions
Main Idea and Details
Quiz
•
5th Grade
20 questions
Context Clues
Quiz
•
6th Grade
Discover more resources for Mathematics
20 questions
Graphing Inequalities on a Number Line
Quiz
•
6th - 9th Grade
20 questions
Exponent Properties
Quiz
•
9th Grade
15 questions
Combine Like Terms and Distributive Property
Quiz
•
8th - 9th Grade
20 questions
Function or Not a Function
Quiz
•
8th - 9th Grade
10 questions
Factor Quadratic Expressions with Various Coefficients
Quiz
•
9th - 12th Grade
10 questions
Elijah McCoy: Innovations and Impact in Black History
Interactive video
•
6th - 10th Grade
21 questions
Factoring Trinomials (a=1)
Quiz
•
9th Grade
5 questions
Triangle Congruence Theorems
Interactive video
•
9th - 12th Grade