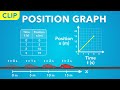
Analyzing Car Motion Graphs
Interactive Video
•
Mathematics, Physics, Science
•
6th - 7th Grade
•
Practice Problem
•
Hard

Patricia Brown
FREE Resource
Read more
5 questions
Show all answers
1.
MULTIPLE CHOICE QUESTION
30 sec • 1 pt
What is the initial position of the car at the start of the observation?
15 meters
0 meters
5 meters
10 meters
2.
MULTIPLE CHOICE QUESTION
30 sec • 1 pt
After how many seconds is the car's position recorded as 10 meters?
2 seconds
1 second
4 seconds
3 seconds
3.
MULTIPLE CHOICE QUESTION
30 sec • 1 pt
Why is time placed on the horizontal axis of the graph?
Because position is always on the vertical axis
To make the graph look better
Because it is a standard convention
To confuse the viewer
4.
MULTIPLE CHOICE QUESTION
30 sec • 1 pt
What is the position of the car when time equals 3 seconds?
10 meters
20 meters
15 meters
5 meters
5.
MULTIPLE CHOICE QUESTION
30 sec • 1 pt
What is the purpose of connecting the plotted points with lines on the graph?
To add more data points
To make it easier to read
To make the graph look more complex
To visualize the motion of the car
Access all questions and much more by creating a free account
Create resources
Host any resource
Get auto-graded reports
Continue with Google

Continue with Email
Continue with Classlink
Continue with Clever
or continue with
Microsoft
%20(1).png)
Apple
Others
Already have an account?
