Understanding Z-scores and Probability
Interactive Video
•
Mathematics, Science, Other
•
9th - 12th Grade
•
Practice Problem
•
Hard

Patricia Brown
FREE Resource
Read more
10 questions
Show all answers
1.
MULTIPLE CHOICE QUESTION
30 sec • 1 pt
What does a Z-score of zero indicate about a raw score?
It is equal to the mean.
It is above the mean.
It is below the mean.
It is twice the mean.
2.
MULTIPLE CHOICE QUESTION
30 sec • 1 pt
How are Z-scores distributed in relation to the mean on a bell curve?
Z-scores are not related to the mean.
Positive Z-scores are to the right of the mean.
Negative Z-scores are to the right of the mean.
Positive Z-scores are to the left of the mean.
3.
MULTIPLE CHOICE QUESTION
30 sec • 1 pt
What is the probability of an observation being between zero and one standard deviation from the mean?
34%
95%
50%
68%
4.
MULTIPLE CHOICE QUESTION
30 sec • 1 pt
What percentage of observations fall between -1 and 1 standard deviation from the mean?
34%
50%
68%
95%
5.
MULTIPLE CHOICE QUESTION
30 sec • 1 pt
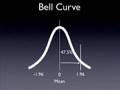
What does a Z-score of 1.96 signify in terms of probability?
47.5% of observations fall within this range.
34% of observations fall within this range.
95% of observations fall within this range.
68% of observations fall within this range.
6.
MULTIPLE CHOICE QUESTION
30 sec • 1 pt
What is the probability that an observation will fall between -1.96 and 1.96 standard deviations from the mean?
34%
95%
50%
68%
7.
MULTIPLE CHOICE QUESTION
30 sec • 1 pt
If 95% of observations are within -1.96 and 1.96, what percentage is in the tails?
15%
10%
5%
2.5%
Access all questions and much more by creating a free account
Create resources
Host any resource
Get auto-graded reports
Continue with Google

Continue with Email
Continue with Classlink
Continue with Clever
or continue with
Microsoft
%20(1).png)
Apple
Others
Already have an account?
