Charles's Law and Graph Interpretation
Interactive Video
•
Mathematics, Physics, Science
•
9th - 10th Grade
•
Practice Problem
•
Hard

Patricia Brown
FREE Resource
Read more
10 questions
Show all answers
1.
MULTIPLE CHOICE QUESTION
30 sec • 1 pt
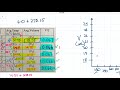
What was the starting point on the x-axis for the graph?
18
280
360
10
2.
MULTIPLE CHOICE QUESTION
30 sec • 1 pt
What increment was used for the y-axis?
2
10
5
1
3.
MULTIPLE CHOICE QUESTION
30 sec • 1 pt
Which temperature was plotted with a volume of 18.75?
279 Kelvin
299 Kelvin
312 Kelvin
327 Kelvin
4.
MULTIPLE CHOICE QUESTION
30 sec • 1 pt
What was the approximate volume for a temperature of 299 Kelvin?
19.75
20.75
18.75
21.75
5.
MULTIPLE CHOICE QUESTION
30 sec • 1 pt
Which temperature was rounded to 312 for plotting?
327
279
353
311
6.
MULTIPLE CHOICE QUESTION
30 sec • 1 pt
What is the relationship between volume and temperature according to Charles's Law?
Direct
Inverse
Exponential
No relationship
7.
MULTIPLE CHOICE QUESTION
30 sec • 1 pt
What kind of line should the graph form according to Charles's Law?
Straight
Vertical
Horizontal
Curved
Access all questions and much more by creating a free account
Create resources
Host any resource
Get auto-graded reports
Continue with Google

Continue with Email
Continue with Classlink
Continue with Clever
or continue with
Microsoft
%20(1).png)
Apple
Others
Already have an account?
Similar Resources on Wayground
Popular Resources on Wayground

15 questions
Fractions on a Number Line
Quiz
•
3rd Grade
20 questions
Equivalent Fractions
Quiz
•
3rd Grade
25 questions
Multiplication Facts
Quiz
•
5th Grade
29 questions
Alg. 1 Section 5.1 Coordinate Plane
Quiz
•
9th Grade
22 questions
fractions
Quiz
•
3rd Grade
11 questions
FOREST Effective communication
Lesson
•
KG
20 questions
Main Idea and Details
Quiz
•
5th Grade
20 questions
Context Clues
Quiz
•
6th Grade
Discover more resources for Mathematics
29 questions
Alg. 1 Section 5.1 Coordinate Plane
Quiz
•
9th Grade
20 questions
Graphing Inequalities on a Number Line
Quiz
•
6th - 9th Grade
20 questions
Box and Whisker Plots
Quiz
•
9th Grade
18 questions
Exponential Growth and Decay
Quiz
•
9th Grade
20 questions
Function or Not a Function
Quiz
•
8th - 9th Grade
20 questions
SSS/SAS
Quiz
•
9th - 12th Grade
14 questions
Making Inferences From Samples
Quiz
•
7th - 12th Grade
23 questions
CCG - CH8 Polygon angles and area Review
Quiz
•
9th - 12th Grade