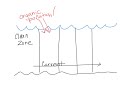
Oxygen Demand and Pollution Effects
Interactive Video
•
Biology, Science, Chemistry
•
9th - 10th Grade
•
Practice Problem
•
Hard

Patricia Brown
FREE Resource
Read more
10 questions
Show all answers
1.
MULTIPLE CHOICE QUESTION
30 sec • 1 pt
What is the primary cause of the oxygen sag curve in water bodies?
Increase in sunlight exposure
Increased fish population
Introduction of organic pollutants
Decrease in water temperature
2.
MULTIPLE CHOICE QUESTION
30 sec • 1 pt
How does the demand for oxygen change as bacteria decompose organic waste?
It does not change
It increases initially and then decreases
It decreases initially and then increases
It remains constant
3.
MULTIPLE CHOICE QUESTION
30 sec • 1 pt
What happens to the dissolved oxygen levels as the demand for oxygen increases?
They increase
They fluctuate randomly
They decrease
They remain constant
4.
MULTIPLE CHOICE QUESTION
30 sec • 1 pt
Which zone in a polluted water body is characterized by the lowest levels of dissolved oxygen?
Recovery zone
Septic zone
Decomposition zone
Clean zone
5.
MULTIPLE CHOICE QUESTION
30 sec • 1 pt
In which zone do fish start to reappear in a polluted water body?
Decomposition zone
Recovery zone
Septic zone
Clean zone
6.
MULTIPLE CHOICE QUESTION
30 sec • 1 pt
What type of pollution is primarily responsible for the oxygen sag curve?
Noise pollution
Organic pollution
Thermal pollution
Inorganic pollution
7.
MULTIPLE CHOICE QUESTION
30 sec • 1 pt
Which of the following is NOT a source of organic pollution?
Storm drains
Plastic waste
Animal waste
Untreated sewage
Access all questions and much more by creating a free account
Create resources
Host any resource
Get auto-graded reports
Continue with Google

Continue with Email
Continue with Classlink
Continue with Clever
or continue with
Microsoft
%20(1).png)
Apple
Others
Already have an account?
