Understanding Line Graphs and Midpoints
Interactive Video
•
Mathematics, Science, Biology
•
5th - 6th Grade
•
Practice Problem
•
Hard

Patricia Brown
FREE Resource
Read more
9 questions
Show all answers
1.
MULTIPLE CHOICE QUESTION
30 sec • 1 pt
What is a line graph primarily used for?
To show the relationship between two variables
To illustrate parts of a whole
To compare different categories
To display data points and trends over time
2.
MULTIPLE CHOICE QUESTION
30 sec • 1 pt
What does the line connecting data points in a line graph represent?
The minimum value of the data
The maximum value of the data
The trend of the data over time
The average of the data points
3.
MULTIPLE CHOICE QUESTION
30 sec • 1 pt
How does the height of the tomato plant change from day one to day two?
It decreases from 2.5 to 2 cm
It remains constant at 2.5 cm
It increases from 2.5 to 5 cm
It increases from 2 to 4 cm
4.
MULTIPLE CHOICE QUESTION
30 sec • 1 pt
What is the height of the tomato plant on day three?
8 cm
5 cm
7.5 cm
6 cm
5.
MULTIPLE CHOICE QUESTION
30 sec • 1 pt
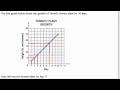
How do you find the height of the tomato plant on day seven using the graph?
By looking at the y-axis directly
By finding the intersection of day seven on the x-axis and the line graph
By calculating the average of all previous heights
By estimating based on the trend
6.
MULTIPLE CHOICE QUESTION
30 sec • 1 pt
What is the height of the tomato plant on day seven?
15 cm
18 cm
17 cm
17.5 cm
7.
MULTIPLE CHOICE QUESTION
30 sec • 1 pt
How can you calculate the midpoint between two numbers?
By subtracting the smaller number from the larger number
By adding the two numbers and dividing by two
By multiplying the two numbers
By finding the difference and dividing by two
Access all questions and much more by creating a free account
Create resources
Host any resource
Get auto-graded reports
Continue with Google

Continue with Email
Continue with Classlink
Continue with Clever
or continue with
Microsoft
%20(1).png)
Apple
Others
Already have an account?
Popular Resources on Wayground

15 questions
Fractions on a Number Line
Quiz
•
3rd Grade
10 questions
Probability Practice
Quiz
•
4th Grade
15 questions
Probability on Number LIne
Quiz
•
4th Grade
20 questions
Equivalent Fractions
Quiz
•
3rd Grade
25 questions
Multiplication Facts
Quiz
•
5th Grade
22 questions
fractions
Quiz
•
3rd Grade
6 questions
Appropriate Chromebook Usage
Lesson
•
7th Grade
10 questions
Greek Bases tele and phon
Quiz
•
6th - 8th Grade
Discover more resources for Mathematics
25 questions
Multiplication Facts
Quiz
•
5th Grade
10 questions
Multiplying Fractions
Quiz
•
5th Grade
20 questions
Writing Algebraic Expressions
Quiz
•
6th Grade
10 questions
Adding and Subtracting Decimals
Quiz
•
5th Grade
20 questions
Ratios/Rates and Unit Rates
Quiz
•
6th Grade
15 questions
Rounding Decimals
Quiz
•
5th Grade
20 questions
Graphing Inequalities on a Number Line
Quiz
•
6th - 9th Grade
22 questions
Adding & Subtracting fractions with like denominators
Quiz
•
3rd - 5th Grade