Data Representation and Interpretation
Interactive Video
•
Mathematics, Science, Arts
•
3rd - 5th Grade
•
Practice Problem
•
Hard

Patricia Brown
FREE Resource
Read more
10 questions
Show all answers
1.
MULTIPLE CHOICE QUESTION
30 sec • 1 pt
What is the primary purpose of using tables and graphs in data collection?
To make data look colorful
To increase the amount of data collected
To keep data organized and easy to interpret
To confuse the data collectors
2.
MULTIPLE CHOICE QUESTION
30 sec • 1 pt
How many tally marks are used to represent five students in a survey?
Five straight lines
Four lines and a slash
Three lines and two slashes
Two lines and three slashes
3.
MULTIPLE CHOICE QUESTION
30 sec • 1 pt
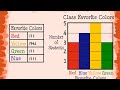
In the classroom survey, which color had the same number of preferences as green?
Red
Blue
Yellow
Purple
4.
MULTIPLE CHOICE QUESTION
30 sec • 1 pt
What is a Venn diagram primarily used for?
To show data in a circular format
To organize data in a tabular form
To display data in a linear format
To compare and contrast overlapping attributes
5.
MULTIPLE CHOICE QUESTION
30 sec • 1 pt
How many students like both apples and oranges according to the Venn diagram?
Five
Three
Seven
Ten
6.
MULTIPLE CHOICE QUESTION
30 sec • 1 pt
What does each stick figure represent in a pictograph?
One student
Four students
Three students
Two students
7.
MULTIPLE CHOICE QUESTION
30 sec • 1 pt
Which subject was favored by the most students in the pictograph example?
Art
Science
Math
Reading
Access all questions and much more by creating a free account
Create resources
Host any resource
Get auto-graded reports
Continue with Google

Continue with Email
Continue with Classlink
Continue with Clever
or continue with
Microsoft
%20(1).png)
Apple
Others
Already have an account?
