- Resource Library
- Math
- Probability And Statistics
- Median Of Grouped Data
- Statistical Measures: Mean, Median, Mode
Statistical Measures: Mean, Median, Mode
Interactive Video
•
Mathematics
•
9th - 10th Grade
•
Practice Problem
•
Hard

Thomas White
FREE Resource
Read more
10 questions
Show all answers
1.
MULTIPLE CHOICE QUESTION
30 sec • 1 pt
What statistical concepts were reviewed at the beginning of the session?
Probability and variance
Standard deviation and range
Mean, median, and mode
Correlation and regression
2.
MULTIPLE CHOICE QUESTION
30 sec • 1 pt
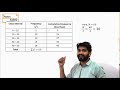
When calculating the mean for grouped data, what is the purpose of the class mark?
To calculate the range of the class
To represent the central value of the class
To determine the frequency of the class
To find the highest value in the class
3.
MULTIPLE CHOICE QUESTION
30 sec • 1 pt
How is the mean calculated for grouped data?
By multiplying class marks with their frequencies and dividing by total frequency
By adding all class marks
By dividing the total number of classes by the total frequency
By finding the midpoint of the data
4.
MULTIPLE CHOICE QUESTION
30 sec • 1 pt
What is the cumulative frequency used for in median calculation?
To calculate the mean
To identify the median class
To determine the class width
To find the total number of observations
5.
MULTIPLE CHOICE QUESTION
30 sec • 1 pt
In the context of median calculation, what does 'n/2' represent?
The cumulative frequency of the median class
The midpoint of the data set
The total number of classes
The total number of observations divided by two
6.
MULTIPLE CHOICE QUESTION
30 sec • 1 pt
Which class is considered the median class?
The class with the lowest frequency
The class with the smallest range
The class where cumulative frequency first exceeds n/2
The class with the highest frequency
7.
MULTIPLE CHOICE QUESTION
30 sec • 1 pt
What is the modal class in a frequency distribution?
The class with the median value
The class with the lowest frequency
The class with the highest frequency
The class with the smallest range
Access all questions and much more by creating a free account
Create resources
Host any resource
Get auto-graded reports
Continue with Google

Continue with Email
Continue with Microsoft
or continue with

%20(1).png)
Apple
Others
Already have an account?
