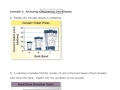
Misleading Data and Graph Interpretation
Interactive Video
•
Mathematics, Science, Other
•
5th - 6th Grade
•
Practice Problem
•
Hard

Thomas White
FREE Resource
Read more
10 questions
Show all answers
1.
MULTIPLE CHOICE QUESTION
30 sec • 1 pt
What is the most recent type of graph introduced in the lesson?
Scatter Plot
Pictograph
Line Graph
Bar Graph
2.
MULTIPLE CHOICE QUESTION
30 sec • 1 pt
Which graph is best for showing changes over time?
Bar Graph
Line Graph
Scatter Plot
Circle Graph
3.
MULTIPLE CHOICE QUESTION
30 sec • 1 pt
What type of graph should be used to compare shoe sizes with heights?
Bar Graph
Line Graph
Histogram
Scatter Plot
4.
MULTIPLE CHOICE QUESTION
30 sec • 1 pt
Which graph is suitable for displaying the population of the United States divided into age groups?
Circle Graph
Histogram
Scatter Plot
Pictograph
5.
MULTIPLE CHOICE QUESTION
30 sec • 1 pt
What type of graph is ideal for comparing parts to a whole?
Line Graph
Bar Graph
Circle Graph
Scatter Plot
6.
MULTIPLE CHOICE QUESTION
30 sec • 1 pt
What can cause data to be misleading in a graph?
Using a line graph
Using a consistent scale
Displaying all data points
Changing the scale
7.
MULTIPLE CHOICE QUESTION
30 sec • 1 pt
Why is it misleading to use a break in a graph where data exists?
It highlights key data points
It simplifies the graph
It skips over important data
It makes the graph look more complex
Access all questions and much more by creating a free account
Create resources
Host any resource
Get auto-graded reports
Continue with Google

Continue with Email
Continue with Classlink
Continue with Clever
or continue with
Microsoft
%20(1).png)
Apple
Others
Already have an account?
Popular Resources on Wayground

15 questions
Fractions on a Number Line
Quiz
•
3rd Grade
20 questions
Equivalent Fractions
Quiz
•
3rd Grade
25 questions
Multiplication Facts
Quiz
•
5th Grade
54 questions
Analyzing Line Graphs & Tables
Quiz
•
4th Grade
22 questions
fractions
Quiz
•
3rd Grade
20 questions
Main Idea and Details
Quiz
•
5th Grade
20 questions
Context Clues
Quiz
•
6th Grade
15 questions
Equivalent Fractions
Quiz
•
4th Grade
Discover more resources for Mathematics
25 questions
Multiplication Facts
Quiz
•
5th Grade
15 questions
Distributive Property & Review
Quiz
•
6th Grade
10 questions
Multiplying Fractions
Quiz
•
5th Grade
20 questions
Writing Algebraic Expressions
Quiz
•
6th Grade
20 questions
Ratios/Rates and Unit Rates
Quiz
•
6th Grade
15 questions
Rounding Decimals
Quiz
•
5th Grade
16 questions
Volume of Rectangular Prisms and Cubes
Quiz
•
5th Grade
20 questions
Graphing Inequalities on a Number Line
Quiz
•
6th - 9th Grade