Understanding Box Plots and Data Analysis
Interactive Video
•
Mathematics
•
6th - 7th Grade
•
Practice Problem
•
Hard

Thomas White
FREE Resource
Read more
10 questions
Show all answers
1.
MULTIPLE CHOICE QUESTION
30 sec • 1 pt
What is the main focus of the lesson introduced by Mr. Kwik?
Understanding pie charts
Learning about histograms
Summarizing distributions using box plots
Creating dot plots
2.
MULTIPLE CHOICE QUESTION
30 sec • 1 pt
What is the total number of students surveyed for the data set?
50 students
27 students
15 students
35 students
3.
MULTIPLE CHOICE QUESTION
30 sec • 1 pt
What is the median value of the data set used in the lesson?
15
10
22
12
4.
MULTIPLE CHOICE QUESTION
30 sec • 1 pt
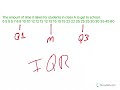
How is the interquartile range (IQR) calculated?
By adding the first and third quartiles
By dividing the sum of all data points by the number of data points
By subtracting the minimum value from the maximum value
By subtracting the first quartile from the third quartile
5.
MULTIPLE CHOICE QUESTION
30 sec • 1 pt
What is the purpose of drawing a box in a box plot?
To indicate the interquartile range
To show the range of the data
To represent the entire data set
To highlight the median value
6.
MULTIPLE CHOICE QUESTION
30 sec • 1 pt
Which value is used to draw a line inside the box in a box plot?
The range
The median
The mode
The mean
7.
MULTIPLE CHOICE QUESTION
30 sec • 1 pt
What is the lowest value in the data set used for the box plot?
8
5
10
12
Access all questions and much more by creating a free account
Create resources
Host any resource
Get auto-graded reports
Continue with Google

Continue with Email
Continue with Classlink
Continue with Clever
or continue with
Microsoft
%20(1).png)
Apple
Others
Already have an account?
Similar Resources on Wayground
Popular Resources on Wayground

7 questions
History of Valentine's Day
Interactive video
•
4th Grade
15 questions
Fractions on a Number Line
Quiz
•
3rd Grade
20 questions
Equivalent Fractions
Quiz
•
3rd Grade
25 questions
Multiplication Facts
Quiz
•
5th Grade
22 questions
fractions
Quiz
•
3rd Grade
15 questions
Valentine's Day Trivia
Quiz
•
3rd Grade
20 questions
Main Idea and Details
Quiz
•
5th Grade
20 questions
Context Clues
Quiz
•
6th Grade
Discover more resources for Mathematics
20 questions
Writing Algebraic Expressions
Quiz
•
6th Grade
20 questions
Ratios/Rates and Unit Rates
Quiz
•
6th Grade
14 questions
Volume of rectangular prisms
Quiz
•
7th Grade
20 questions
Graphing Inequalities on a Number Line
Quiz
•
6th - 9th Grade
20 questions
One Step Equations
Quiz
•
6th Grade
10 questions
Solving One Step Inequalities
Quiz
•
6th Grade
15 questions
Equivalent Ratios
Quiz
•
6th Grade
16 questions
2022 Winter Olympics Medal Table
Passage
•
6th - 8th Grade