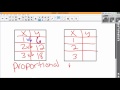
Proportional vs Nonproportional Relationships
Interactive Video
•
Mathematics
•
6th - 7th Grade
•
Practice Problem
•
Hard

Thomas White
FREE Resource
Read more
10 questions
Show all answers
1.
MULTIPLE CHOICE QUESTION
30 sec • 1 pt
What activity did students perform to understand proportional and nonproportional relationships?
They wrote essays.
They conducted a gallery walk.
They solved equations.
They watched a documentary.
2.
MULTIPLE CHOICE QUESTION
30 sec • 1 pt
What is the key feature of a proportional relationship in a table?
A constant division.
A constant multiplier.
A constant subtraction.
A constant addition.
3.
MULTIPLE CHOICE QUESTION
30 sec • 1 pt
In a proportional relationship, if you multiply 1 by 6 to get 6, what should you multiply 2 by to maintain proportionality?
3
6
12
18
4.
MULTIPLE CHOICE QUESTION
30 sec • 1 pt
Why is the example with constants 6, 5, and 8 considered nonproportional?
The constants are negative.
The constants are different.
The constants are all the same.
The constants are zero.
5.
MULTIPLE CHOICE QUESTION
30 sec • 1 pt
What is a characteristic of a graph representing a proportional relationship?
It forms a curve.
It starts at the origin and is a straight line.
It has multiple lines.
It forms a circle.
6.
MULTIPLE CHOICE QUESTION
30 sec • 1 pt
What happens to the y-value in a proportional relationship when the x-value is zero?
It becomes undefined.
It becomes zero.
It becomes negative.
It becomes positive.
7.
MULTIPLE CHOICE QUESTION
30 sec • 1 pt
If a graph does not start at the origin, what type of relationship does it likely represent?
Linear
Exponential
Proportional
Nonproportional
Access all questions and much more by creating a free account
Create resources
Host any resource
Get auto-graded reports
Continue with Google

Continue with Email
Continue with Classlink
Continue with Clever
or continue with
Microsoft
%20(1).png)
Apple
Others
Already have an account?
