Analyzing Graphs of Functions
Interactive Video
•
Mathematics
•
9th - 10th Grade
•
Practice Problem
•
Hard

Thomas White
FREE Resource
Read more
10 questions
Show all answers
1.
MULTIPLE CHOICE QUESTION
30 sec • 1 pt
What is the primary focus of the lesson on increasing and decreasing functions?
Studying the history of mathematics
Analyzing graphs of functions in real-world contexts
Learning about quadratic equations
Understanding the concept of constant rates
2.
MULTIPLE CHOICE QUESTION
30 sec • 1 pt
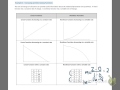
In the running scenarios, what distinguishes Ali's graph from Shannon's?
Both graphs are nonlinear
Both graphs are linear
Ali's graph shows a constant rate, while Shannon's does not
Ali's graph is nonlinear, while Shannon's is linear
3.
MULTIPLE CHOICE QUESTION
30 sec • 1 pt
What does a linear function's graph typically represent?
A decreasing function
A quadratic function
A variable rate of change
A constant rate of change
4.
MULTIPLE CHOICE QUESTION
30 sec • 1 pt
How can you identify a nonlinear function from its graph?
It forms a straight line
It is always decreasing
It has a variable rate of change
It has a constant slope
5.
MULTIPLE CHOICE QUESTION
30 sec • 1 pt
What is the expected shape of a graph representing a large breed dog's growth?
A straight line
A zigzag pattern
A curve that levels off
A downward slope
6.
MULTIPLE CHOICE QUESTION
30 sec • 1 pt
When sketching a graph of a battery charging at a constant rate, what should it look like?
A horizontal line
A vertical line
A straight line with a positive slope
A curve that levels off
7.
MULTIPLE CHOICE QUESTION
30 sec • 1 pt
In the Ferris wheel scenario, what does the graph's periodic nature represent?
The constant speed of the Ferris wheel
The diameter of the Ferris wheel
The changing height of the Ferris wheel over time
The number of passengers on the Ferris wheel
Access all questions and much more by creating a free account
Create resources
Host any resource
Get auto-graded reports
Continue with Google

Continue with Email
Continue with Microsoft
or continue with

%20(1).png)
Apple
Others
Already have an account?
