Analyzing Scatter Plots Relationships
Interactive Video
•
Mathematics
•
6th - 7th Grade
•
Practice Problem
•
Hard

Thomas White
FREE Resource
Read more
10 questions
Show all answers
1.
MULTIPLE CHOICE QUESTION
30 sec • 1 pt
What is the main focus of this lesson?
Studying pie charts
Analyzing scatter plots
Creating scatter plots
Learning about bar graphs
2.
MULTIPLE CHOICE QUESTION
30 sec • 1 pt
What was the relationship explored in the previous lesson using scatter plots?
The relationship between car brands and popularity
The relationship between car weights and fuel mileage
The relationship between car colors and prices
The relationship between car sizes and speed
3.
MULTIPLE CHOICE QUESTION
30 sec • 1 pt
What question should you ask to determine if a scatter plot shows a relationship?
Are the points labeled?
Are the points colorful?
Is there a pattern or trend in the points?
Do the points form a circle?
4.
MULTIPLE CHOICE QUESTION
30 sec • 1 pt
How can you identify a positive linear relationship in a scatter plot?
The line goes from higher to lower as you move left to right
The line is horizontal
The line goes from lower to higher as you move left to right
The line is vertical
5.
MULTIPLE CHOICE QUESTION
30 sec • 1 pt
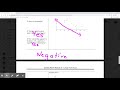
What does a negative linear relationship look like in a scatter plot?
The line goes from higher to lower as you move left to right
The line is horizontal
The line is vertical
The line goes from lower to higher as you move left to right
6.
MULTIPLE CHOICE QUESTION
30 sec • 1 pt
In the first scatter plot example, what type of relationship was identified?
Curved relationship
Negative linear relationship
Positive linear relationship
No relationship
7.
MULTIPLE CHOICE QUESTION
30 sec • 1 pt
What is an outlier in the context of scatter plots?
A point that fits perfectly with the trend
A point that is far from the rest of the data
A point that is the same as all others
A point that is at the center of the plot
Access all questions and much more by creating a free account
Create resources
Host any resource
Get auto-graded reports
Continue with Google

Continue with Email
Continue with Classlink
Continue with Clever
or continue with
Microsoft
%20(1).png)
Apple
Others
Already have an account?
Similar Resources on Wayground
Popular Resources on Wayground

15 questions
Fractions on a Number Line
Quiz
•
3rd Grade
10 questions
Probability Practice
Quiz
•
4th Grade
15 questions
Probability on Number LIne
Quiz
•
4th Grade
20 questions
Equivalent Fractions
Quiz
•
3rd Grade
25 questions
Multiplication Facts
Quiz
•
5th Grade
22 questions
fractions
Quiz
•
3rd Grade
6 questions
Appropriate Chromebook Usage
Lesson
•
7th Grade
10 questions
Greek Bases tele and phon
Quiz
•
6th - 8th Grade
Discover more resources for Mathematics
20 questions
Writing Algebraic Expressions
Quiz
•
6th Grade
20 questions
Ratios/Rates and Unit Rates
Quiz
•
6th Grade
14 questions
Volume of rectangular prisms
Quiz
•
7th Grade
15 questions
Graphing Inequalities
Quiz
•
7th - 9th Grade
20 questions
Graphing Inequalities on a Number Line
Quiz
•
6th - 9th Grade
20 questions
One Step Equations
Quiz
•
6th Grade
12 questions
One-Step Equations
Quiz
•
6th Grade
6 questions
Equations from models
Quiz
•
6th Grade