Understanding Linear Models and Trends
Interactive Video
•
Mathematics, Science, Other
•
9th - 12th Grade
•
Practice Problem
•
Hard

Thomas White
FREE Resource
Read more
10 questions
Show all answers
1.
MULTIPLE CHOICE QUESTION
30 sec • 1 pt
What is the primary focus of lesson 11 in module 6?
Understanding quadratic models
Exploring linear models in a data context
Studying exponential growth
Analyzing geometric sequences
2.
MULTIPLE CHOICE QUESTION
30 sec • 1 pt
In the Old Faithful example, what is the dependent variable?
Amount of water
Height of eruption
Length of eruption
Temperature of water
3.
MULTIPLE CHOICE QUESTION
30 sec • 1 pt
What does the slope represent in the Old Faithful linear model?
Minutes per gallon
Minutes per eruption
Gallons per eruption
Gallons per minute
4.
MULTIPLE CHOICE QUESTION
30 sec • 1 pt
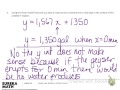
Why might the y-intercept not make sense in the context of the Old Faithful model?
It indicates the average water output
It predicts the maximum water output
It shows the minimum water output
It predicts water output when there is no eruption
5.
MULTIPLE CHOICE QUESTION
30 sec • 1 pt
In the Olympic race data, what trend is observed over the years?
Times fluctuate randomly
Times remain constant
Times are decreasing
Times are increasing
6.
MULTIPLE CHOICE QUESTION
30 sec • 1 pt
How does the linear model help in predicting future Olympic race times?
By ignoring past data
By considering only the fastest times
By calculating the average of past times
By using past trends to estimate future times
7.
MULTIPLE CHOICE QUESTION
30 sec • 1 pt
What does a negative slope indicate in the context of the Olympic race data?
Times are getting slower
Times are getting faster
Times are unpredictable
Times are constant
Access all questions and much more by creating a free account
Create resources
Host any resource
Get auto-graded reports
Continue with Google

Continue with Email
Continue with Classlink
Continue with Clever
or continue with
Microsoft
%20(1).png)
Apple
Others
Already have an account?
Popular Resources on Wayground

15 questions
Fractions on a Number Line
Quiz
•
3rd Grade
20 questions
Equivalent Fractions
Quiz
•
3rd Grade
25 questions
Multiplication Facts
Quiz
•
5th Grade
29 questions
Alg. 1 Section 5.1 Coordinate Plane
Quiz
•
9th Grade
22 questions
fractions
Quiz
•
3rd Grade
11 questions
FOREST Effective communication
Lesson
•
KG
20 questions
Main Idea and Details
Quiz
•
5th Grade
20 questions
Context Clues
Quiz
•
6th Grade
Discover more resources for Mathematics
29 questions
Alg. 1 Section 5.1 Coordinate Plane
Quiz
•
9th Grade
20 questions
Graphing Inequalities on a Number Line
Quiz
•
6th - 9th Grade
20 questions
Box and Whisker Plots
Quiz
•
9th Grade
18 questions
Exponential Growth and Decay
Quiz
•
9th Grade
20 questions
Function or Not a Function
Quiz
•
8th - 9th Grade
20 questions
SSS/SAS
Quiz
•
9th - 12th Grade
14 questions
Making Inferences From Samples
Quiz
•
7th - 12th Grade
23 questions
CCG - CH8 Polygon angles and area Review
Quiz
•
9th - 12th Grade