- Resource Library
- Math
- Data And Graphing
- Histogram Interpretation
- Understanding Histograms And Data Interpretation
Understanding Histograms and Data Interpretation
Interactive Video
•
Mathematics
•
6th - 7th Grade
•
Practice Problem
•
Hard

Thomas White
FREE Resource
Read more
10 questions
Show all answers
1.
MULTIPLE CHOICE QUESTION
30 sec • 1 pt
What is a histogram primarily used for?
Showing the relationship between two variables
Displaying the frequency of data within equal intervals
Illustrating the trend over time
Comparing different categories
2.
MULTIPLE CHOICE QUESTION
30 sec • 1 pt
What does the height of a bar in a histogram represent?
The average value of the data
The total number of data points
The maximum value in the data set
The frequency of data within that interval
3.
MULTIPLE CHOICE QUESTION
30 sec • 1 pt
In the Main Street Park tree ages histogram, what does a taller bar indicate?
The trees are older
The trees are younger
Fewer trees were removed
More trees were planted in that age range
4.
MULTIPLE CHOICE QUESTION
30 sec • 1 pt
In the tree ages histogram, what might a shorter bar for older trees suggest?
Older trees are taller
Older trees are more common
Older trees were removed or fewer were planted
Older trees are healthier
5.
MULTIPLE CHOICE QUESTION
30 sec • 1 pt
What conclusion can be drawn from the student pets histogram?
Most students have more than three pets
Having two or three pets is common among students
All students have the same number of pets
No students have pets
6.
MULTIPLE CHOICE QUESTION
30 sec • 1 pt
What is the least common number of pets among students according to the histogram?
Six to seven pets
Four to five pets
Two to three pets
Zero to one pet
7.
MULTIPLE CHOICE QUESTION
30 sec • 1 pt
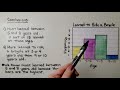
According to the bicycle learning age histogram, at what age do most children learn to ride a bicycle?
Eleven or twelve years old
Nine or ten years old
Five to eight years old
Three or four years old
Access all questions and much more by creating a free account
Create resources
Host any resource
Get auto-graded reports
Continue with Google

Continue with Email
Continue with Microsoft
or continue with

%20(1).png)
Apple
Others
Already have an account?
