Analyzing Data Sets and Histograms
Interactive Video
•
Mathematics
•
6th - 7th Grade
•
Practice Problem
•
Hard

Thomas White
FREE Resource
Read more
10 questions
Show all answers
1.
MULTIPLE CHOICE QUESTION
30 sec • 1 pt
What is the main objective of using histograms in this lesson?
To compare different types of graphs
To determine the mode of the data
To calculate the exact number of data points
To describe the distribution of data and find a typical value
2.
MULTIPLE CHOICE QUESTION
30 sec • 1 pt
What does the 'center' of a data set refer to?
The lowest value in the data set
The mean or average of the data set
The most frequently occurring value
The highest value in the data set
3.
MULTIPLE CHOICE QUESTION
30 sec • 1 pt
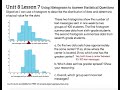
In the histograms shown, where is the center located for both sixth and seventh graders?
Between 95 and 100 text messages
Between 80 and 85 text messages
Between 105 and 110 text messages
Between 115 and 120 text messages
4.
MULTIPLE CHOICE QUESTION
30 sec • 1 pt
What does the 'spread' of a data set indicate?
The most common value in the data set
The range between the minimum and maximum values
The total number of data points
The average value of the data set
5.
MULTIPLE CHOICE QUESTION
30 sec • 1 pt
Which group showed more variability in the number of text messages sent?
Both groups showed the same variability
Neither group showed any variability
Seventh graders
Sixth graders
6.
MULTIPLE CHOICE QUESTION
30 sec • 1 pt
How do you determine which group sent more text messages overall?
By comparing the highest values in each group
By looking at the mean of each group
By counting the total number of messages
By comparing the lowest values in each group
7.
MULTIPLE CHOICE QUESTION
30 sec • 1 pt
What conclusion can be drawn about the number of text messages sent by both groups?
Sixth graders sent significantly more messages
Seventh graders sent significantly more messages
Both groups sent about the same number of messages
Neither group sent any messages
Access all questions and much more by creating a free account
Create resources
Host any resource
Get auto-graded reports
Continue with Google

Continue with Email
Continue with Classlink
Continue with Clever
or continue with
Microsoft
%20(1).png)
Apple
Others
Already have an account?
