Understanding Histograms and Data Distribution
Interactive Video
•
Mathematics
•
6th - 7th Grade
•
Practice Problem
•
Hard

Thomas White
FREE Resource
Read more
10 questions
Show all answers
1.
MULTIPLE CHOICE QUESTION
30 sec • 1 pt
What is the main focus of Mrs. Ney's lesson in the video?
Arithmetic operations
Describing distributions on histograms
Solving algebraic equations
Understanding geometric shapes
2.
MULTIPLE CHOICE QUESTION
30 sec • 1 pt
What is the first step in sorting histograms according to Mrs. Ney?
Determining symmetry
Checking for gaps
Measuring the spread
Identifying the peak
3.
MULTIPLE CHOICE QUESTION
30 sec • 1 pt
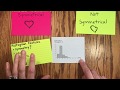
What does Mrs. Ney use to illustrate symmetry in histograms?
A heart drawing
A pie chart
A bar graph
A line graph
4.
MULTIPLE CHOICE QUESTION
30 sec • 1 pt
Which histogram feature is described as having a high point in the data?
Cluster
Gap
Peak
Spread
5.
MULTIPLE CHOICE QUESTION
30 sec • 1 pt
What does Mrs. Ney suggest about the spread of data in a histogram?
It is always clustered
It can vary widely
It is always symmetrical
It has no gaps
6.
MULTIPLE CHOICE QUESTION
30 sec • 1 pt
What is a common feature of histograms that Mrs. Ney highlights?
They always have a peak
They never have gaps
They can have clusters of data
They are always symmetrical
7.
MULTIPLE CHOICE QUESTION
30 sec • 1 pt
What distinguishes a bar graph from a histogram?
Bar graphs have numerical data on the x-axis
Histograms represent categorical data
Bar graphs can have bars in any order
Histograms have spaces between bars
Access all questions and much more by creating a free account
Create resources
Host any resource
Get auto-graded reports
Continue with Google

Continue with Email
Continue with Classlink
Continue with Clever
or continue with
Microsoft
%20(1).png)
Apple
Others
Already have an account?
Similar Resources on Wayground

6 questions
Understanding Arithmetic Mean and Graph Interpretation
Interactive video
•
6th - 7th Grade
9 questions
Understanding Functions and Graphs
Interactive video
•
6th - 8th Grade
11 questions
Understanding Mrs. Chan's Pencil Problem
Interactive video
•
6th - 7th Grade
11 questions
Understanding the Area of a Trapezoid
Interactive video
•
6th - 7th Grade
11 questions
Understanding Percentages and Proportions
Interactive video
•
6th - 7th Grade
11 questions
Inferences and Data Interpretation
Interactive video
•
6th - 8th Grade
11 questions
Operations with Rational Numbers
Interactive video
•
6th - 8th Grade
6 questions
Magnetism Experiment Quiz
Interactive video
•
6th - 7th Grade
Popular Resources on Wayground
7 questions
History of Valentine's Day
Interactive video
•
4th Grade
15 questions
Fractions on a Number Line
Quiz
•
3rd Grade
20 questions
Equivalent Fractions
Quiz
•
3rd Grade
25 questions
Multiplication Facts
Quiz
•
5th Grade
22 questions
fractions
Quiz
•
3rd Grade
15 questions
Valentine's Day Trivia
Quiz
•
3rd Grade
20 questions
Main Idea and Details
Quiz
•
5th Grade
20 questions
Context Clues
Quiz
•
6th Grade
Discover more resources for Mathematics
20 questions
Writing Algebraic Expressions
Quiz
•
6th Grade
20 questions
Ratios/Rates and Unit Rates
Quiz
•
6th Grade
14 questions
Volume of rectangular prisms
Quiz
•
7th Grade
20 questions
Graphing Inequalities on a Number Line
Quiz
•
6th - 9th Grade
20 questions
One Step Equations
Quiz
•
6th Grade
10 questions
Solving One Step Inequalities
Quiz
•
6th Grade
15 questions
Equivalent Ratios
Quiz
•
6th Grade
16 questions
2022 Winter Olympics Medal Table
Passage
•
6th - 8th Grade