Statistics and Data Interpretation
Interactive Video
•
Mathematics, Science, Biology
•
4th - 5th Grade
•
Practice Problem
•
Hard

Thomas White
FREE Resource
Read more
10 questions
Show all answers
1.
MULTIPLE CHOICE QUESTION
30 sec • 1 pt
What is the primary purpose of using histograms in statistics?
To create artistic designs
To compare different species
To answer statistical questions
To measure the length of objects
2.
MULTIPLE CHOICE QUESTION
30 sec • 1 pt
Why is it important to use a ruler when measuring earthworms?
To ensure accurate measurements
To draw straight lines
To make the earthworms longer
To compare them with other insects
3.
MULTIPLE CHOICE QUESTION
30 sec • 1 pt
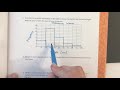
What is the typical length of the earthworms based on the histogram?
30 millimeters
70 millimeters
10 millimeters
50 millimeters
4.
MULTIPLE CHOICE QUESTION
30 sec • 1 pt
In a histogram, what does the y-axis typically represent?
The length of the objects
The frequency of data
The color of the bars
The width of the bars
5.
MULTIPLE CHOICE QUESTION
30 sec • 1 pt
Which group of players is generally taller according to the histograms?
Tennis players
Soccer players
Basketball players
Baseball players
6.
MULTIPLE CHOICE QUESTION
30 sec • 1 pt
What is the center of the height distribution for basketball players?
69 inches
79 inches
99 inches
89 inches
7.
MULTIPLE CHOICE QUESTION
30 sec • 1 pt
What should be considered when choosing the interval size for a histogram?
The shape of the graph
The color of the bars
The range of the data
The number of data points
Access all questions and much more by creating a free account
Create resources
Host any resource
Get auto-graded reports
Continue with Google

Continue with Email
Continue with Microsoft
or continue with

%20(1).png)
Apple
Others
Already have an account?
