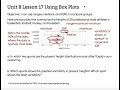
Understanding Box Plots and Data Variability
Interactive Video
•
Mathematics
•
6th - 7th Grade
•
Practice Problem
•
Hard

Thomas White
FREE Resource
Read more
10 questions
Show all answers
1.
MULTIPLE CHOICE QUESTION
30 sec • 1 pt
What does the vertical line in the middle of a box plot represent?
The average of the data
The range of the data
The median of the data
The mode of the data
2.
MULTIPLE CHOICE QUESTION
30 sec • 1 pt
How is the range of a dataset calculated?
By identifying the most frequent value
By finding the average of the dataset
By subtracting the minimum from the maximum value
By adding the minimum and maximum values
3.
MULTIPLE CHOICE QUESTION
30 sec • 1 pt
What does the interquartile range (IQR) represent in a dataset?
The middle 50% of the data
The average of the dataset
The most frequent value in the dataset
The spread of the entire dataset
4.
MULTIPLE CHOICE QUESTION
30 sec • 1 pt
Which two sports have the most similar height distributions according to the box plots?
Hockey and Baseball
Basketball and Football
Basketball and Hockey
Football and Baseball
5.
MULTIPLE CHOICE QUESTION
30 sec • 1 pt
What is the primary reason for comparing medians, ranges, and IQRs in data distributions?
To calculate the total number of data points
To identify similarities and differences in data spread
To determine the most common height
To find the average height
6.
MULTIPLE CHOICE QUESTION
30 sec • 1 pt
How can tracing paper be used in comparing box plots?
To determine the total number of data points
To compare the size of interquartile ranges
To find the mode
To calculate the average
7.
MULTIPLE CHOICE QUESTION
30 sec • 1 pt
Which sport shows the greatest variability in player heights?
Baseball
Football
Hockey
Basketball
Access all questions and much more by creating a free account
Create resources
Host any resource
Get auto-graded reports
Continue with Google

Continue with Email
Continue with Classlink
Continue with Clever
or continue with
Microsoft
%20(1).png)
Apple
Others
Already have an account?
Popular Resources on Wayground

15 questions
Fractions on a Number Line
Quiz
•
3rd Grade
20 questions
Equivalent Fractions
Quiz
•
3rd Grade
25 questions
Multiplication Facts
Quiz
•
5th Grade
54 questions
Analyzing Line Graphs & Tables
Quiz
•
4th Grade
22 questions
fractions
Quiz
•
3rd Grade
20 questions
Main Idea and Details
Quiz
•
5th Grade
20 questions
Context Clues
Quiz
•
6th Grade
15 questions
Equivalent Fractions
Quiz
•
4th Grade
Discover more resources for Mathematics
22 questions
distributive property
Quiz
•
7th Grade
18 questions
Angle Relationships
Quiz
•
7th Grade
15 questions
Distributive Property & Review
Quiz
•
6th Grade
20 questions
Writing Algebraic Expressions
Quiz
•
6th Grade
20 questions
How Some Friendships Last — and Others Don’t Video Questions
Quiz
•
7th Grade
20 questions
Ratios/Rates and Unit Rates
Quiz
•
6th Grade
18 questions
Handbook Refresher Quiz
Quiz
•
7th Grade
20 questions
Graphing Inequalities on a Number Line
Quiz
•
6th - 9th Grade