
- Resource Library
- Math
- Probability And Statistics
- Five Number Summary
- Understanding Box Plots And Data Analysis
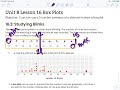
Understanding Box Plots and Data Analysis

Interactive Video
•
Mathematics
•
6th - 7th Grade
•
Practice Problem
•
Hard

Thomas White
FREE Resource
Read more
10 questions
Show all answers
1.
MULTIPLE CHOICE QUESTION
30 sec • 1 pt
What is the main objective of the lesson on boxplots?
To compare different types of plots
To learn how to calculate the mean of a data set
To understand how to use a five-number summary to draw a box plot
To explore the history of boxplots
2.
MULTIPLE CHOICE QUESTION
30 sec • 1 pt
What was the study about in the data set used for the lesson?
The number of times people blink while reading
The number of times people blink while exercising
The number of times people blink while watching a video game
The number of times people blink while sleeping
3.
MULTIPLE CHOICE QUESTION
30 sec • 1 pt
What is the median value in the given data set?
12
15
51
21
4.
MULTIPLE CHOICE QUESTION
30 sec • 1 pt
Which value represents the first quartile (Q1) in the data set?
12
21
3
15
5.
MULTIPLE CHOICE QUESTION
30 sec • 1 pt
What is the maximum value in the five-number summary?
21
12
51
3
6.
MULTIPLE CHOICE QUESTION
30 sec • 1 pt
What does the interquartile range (IQR) represent in a box plot?
The range of the entire data set
The sum of all data points
The average of the data set
The middle 50% of the data
7.
MULTIPLE CHOICE QUESTION
30 sec • 1 pt
What is the purpose of the 'whiskers' in a box plot?
To show the mean of the data
To indicate the range of the middle 50% of the data
To display the mode of the data
To represent the minimum and maximum values
Access all questions and much more by creating a free account
Create resources
Host any resource
Get auto-graded reports

Continue with Google

Continue with Email

Continue with Microsoft
or continue with

%20(1).png)
Apple

Others
By signing up, you agree to our Terms of Service & Privacy Policy
Already have an account?

