Understanding Tides and Simulations
Interactive Video
•
Physics
•
6th - 8th Grade
•
Practice Problem
•
Hard

Patricia Brown
FREE Resource
Read more
10 questions
Show all answers
1.
MULTIPLE CHOICE QUESTION
30 sec • 1 pt
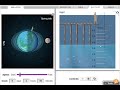
What does the left panel of the tide simulation tool display?
The name of the fisherman
The position of the Sun
The simulation of Earth and tides
The speed of the simulation
2.
MULTIPLE CHOICE QUESTION
30 sec • 1 pt
What information is NOT shown in the left panel of the simulation?
The position of the Moon
The name of the tide
The position of the fisherman
The temperature of the water
3.
MULTIPLE CHOICE QUESTION
30 sec • 1 pt
Which control allows you to change the speed of the simulation?
Reset control
Data table control
Speed control
Pause control
4.
MULTIPLE CHOICE QUESTION
30 sec • 1 pt
What happens when you reset the simulation?
It returns to day zero, hour zero, minute zero
It shows the data table
It changes the speed to maximum
It pauses the simulation
5.
MULTIPLE CHOICE QUESTION
30 sec • 1 pt
What does the bar chart in the simulation represent?
The time of day
The position of the Moon
The speed of the simulation
The tides and the fisherman's position
6.
MULTIPLE CHOICE QUESTION
30 sec • 1 pt
How many high tides occur each day according to the graph?
Four
Three
Two
One
7.
MULTIPLE CHOICE QUESTION
30 sec • 1 pt
What does the graph in the simulation help you understand?
The speed of the tides
The pattern of high and low tides
The position of the Sun
The fisherman's activities
Access all questions and much more by creating a free account
Create resources
Host any resource
Get auto-graded reports
Continue with Google

Continue with Email
Continue with Classlink
Continue with Clever
or continue with
Microsoft
%20(1).png)
Apple
Others
Already have an account?
