Tropical Rainforest Climate Concepts
Interactive Video
•
Geography
•
9th - 10th Grade
•
Practice Problem
•
Hard

Patricia Brown
FREE Resource
Read more
10 questions
Show all answers
1.
MULTIPLE CHOICE QUESTION
30 sec • 1 pt
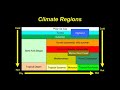
What does the schematic representation of climate regions primarily show?
The political boundaries of countries
The various climate regions of the world
The distribution of animal species
The economic activities in different regions
2.
MULTIPLE CHOICE QUESTION
30 sec • 1 pt
Where are the hottest and wettest climate regions located on the schematic?
Top right
Bottom left
Bottom right
Top left
3.
MULTIPLE CHOICE QUESTION
30 sec • 1 pt
Which characteristic is NOT true about the tropical rainforest climate?
Consistent day length
High climate variability
High sun angle
Minimal temperature difference between January and July
4.
MULTIPLE CHOICE QUESTION
30 sec • 1 pt
What role does the ITCZ play in the tropical rainforest climate?
It reduces cloud cover
It brings a lot of precipitation and cloud cover
It increases temperature variability
It decreases precipitation
5.
MULTIPLE CHOICE QUESTION
30 sec • 1 pt
What is the effect of cloud cover in tropical rainforests?
It reduces humidity
It decreases precipitation
It moderates temperatures
It increases temperature variability
6.
MULTIPLE CHOICE QUESTION
30 sec • 1 pt
What does a climatograph illustrate?
The population density of a region
The political boundaries of a region
The economic activities in a region
Rainfall and temperature patterns over a year
7.
MULTIPLE CHOICE QUESTION
30 sec • 1 pt
What does the blue line on a climatograph represent?
Rainfall
Temperature
Humidity
Wind speed
Access all questions and much more by creating a free account
Create resources
Host any resource
Get auto-graded reports
Continue with Google

Continue with Email
Continue with Classlink
Continue with Clever
or continue with
Microsoft
%20(1).png)
Apple
Others
Already have an account?
