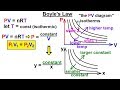
Boyle's Law and PV Diagrams
Interactive Video
•
Physics
•
9th - 10th Grade
•
Practice Problem
•
Hard

Patricia Brown
FREE Resource
Read more
10 questions
Show all answers
1.
MULTIPLE CHOICE QUESTION
30 sec • 1 pt
What does the PV diagram represent in the context of Boyle's Law?
Pressure and temperature
Pressure and volume
Temperature and time
Volume and temperature
2.
MULTIPLE CHOICE QUESTION
30 sec • 1 pt
In the ideal gas equation PV = NRT, what remains constant according to Boyle's Law?
Temperature
Pressure
Number of moles
Volume
3.
MULTIPLE CHOICE QUESTION
30 sec • 1 pt
What is an isotherm in the context of a PV diagram?
A line representing constant pressure
A line representing constant volume
A line representing constant time
A line representing constant temperature
4.
MULTIPLE CHOICE QUESTION
30 sec • 1 pt
How does the pressure change when the volume decreases in an isothermal process?
Pressure increases
Pressure fluctuates
Pressure remains constant
Pressure decreases
5.
MULTIPLE CHOICE QUESTION
30 sec • 1 pt
What happens to the value of Y when X increases in the equation Y = constant/X?
Y decreases
Y fluctuates
Y increases
Y remains constant
6.
MULTIPLE CHOICE QUESTION
30 sec • 1 pt
In a PV diagram, what does a higher isotherm indicate?
Higher time
Higher temperature
Higher volume
Higher pressure
7.
MULTIPLE CHOICE QUESTION
30 sec • 1 pt
What determines the position of an isotherm on a PV diagram?
Time
Temperature
Volume
Pressure
Access all questions and much more by creating a free account
Create resources
Host any resource
Get auto-graded reports
Continue with Google

Continue with Email
Continue with Classlink
Continue with Clever
or continue with
Microsoft
%20(1).png)
Apple
Others
Already have an account?
