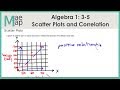
Scatter Plot Relationships and Interpretations
Interactive Video
•
Mathematics
•
6th - 7th Grade
•
Practice Problem
•
Hard

Patricia Brown
FREE Resource
Read more
10 questions
Show all answers
1.
MULTIPLE CHOICE QUESTION
30 sec • 1 pt
What is the primary purpose of a scatter plot?
To display a single data point
To show a relationship between two data sets
To list data in a table format
To calculate averages
2.
MULTIPLE CHOICE QUESTION
30 sec • 1 pt
In a scatter plot, what does a positive relationship indicate?
The variables are unrelated
As one variable increases, the other also increases
There is no change in the variables
As one variable increases, the other decreases
3.
MULTIPLE CHOICE QUESTION
30 sec • 1 pt
What is the trend shown in the height vs. weight scatter plot?
Cyclic relationship
Positive relationship
No relationship
Negative relationship
4.
MULTIPLE CHOICE QUESTION
30 sec • 1 pt
What is the significance of a squiggly line in a scatter plot?
It indicates a positive trend
It marks the origin
It highlights the highest point
It shows a break in the data
5.
MULTIPLE CHOICE QUESTION
30 sec • 1 pt
In the dog feeding scatter plot, what happens as the number of feedings increases?
The amount of food left fluctuates randomly
The amount of food left remains constant
The amount of food left decreases
The amount of food left increases
6.
MULTIPLE CHOICE QUESTION
30 sec • 1 pt
What type of relationship is shown in the dog feeding vs. food left scatter plot?
Positive relationship
No relationship
Cyclic relationship
Negative relationship
7.
MULTIPLE CHOICE QUESTION
30 sec • 1 pt
What does a negative relationship in a scatter plot indicate?
The variables are unrelated
Both variables remain constant
As one variable increases, the other decreases
As one variable increases, the other increases
Access all questions and much more by creating a free account
Create resources
Host any resource
Get auto-graded reports
Continue with Google

Continue with Email
Continue with Classlink
Continue with Clever
or continue with
Microsoft
%20(1).png)
Apple
Others
Already have an account?
