Understanding Graphs and Data Representation
Interactive Video
•
Mathematics
•
5th - 6th Grade
•
Practice Problem
•
Hard

Patricia Brown
FREE Resource
Read more
10 questions
Show all answers
1.
MULTIPLE CHOICE QUESTION
30 sec • 1 pt
Which type of graph is used to show data in a circular format?
Pie graph
Bar graph
Tally marks
Line graph
2.
MULTIPLE CHOICE QUESTION
30 sec • 1 pt
In a bar graph, what does the height of a bar represent?
The type of data
The color of the data
The frequency of the data
The width of the data
3.
MULTIPLE CHOICE QUESTION
30 sec • 1 pt
What is the first step in drawing a bar graph?
Choose a title
Shade the bars
Draw two perpendicular lines
Label the axes
4.
MULTIPLE CHOICE QUESTION
30 sec • 1 pt
In a pie graph, what does a larger slice represent?
Equal data
No data
More data
Less data
5.
MULTIPLE CHOICE QUESTION
30 sec • 1 pt
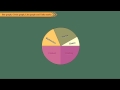
How many students did not vote for the red shirt color in the pie chart example?
75
100
50
25
6.
MULTIPLE CHOICE QUESTION
30 sec • 1 pt
What is a line graph typically used to show?
Data over time
Data in a pictorial format
Data in a circular format
Data in a tabular format
7.
MULTIPLE CHOICE QUESTION
30 sec • 1 pt
In the line graph example, which month had the highest profit?
June
July
April
December
Access all questions and much more by creating a free account
Create resources
Host any resource
Get auto-graded reports
Continue with Google

Continue with Email
Continue with Classlink
Continue with Clever
or continue with
Microsoft
%20(1).png)
Apple
Others
Already have an account?
Similar Resources on Wayground
Popular Resources on Wayground

7 questions
History of Valentine's Day
Interactive video
•
4th Grade
15 questions
Fractions on a Number Line
Quiz
•
3rd Grade
20 questions
Equivalent Fractions
Quiz
•
3rd Grade
25 questions
Multiplication Facts
Quiz
•
5th Grade
22 questions
fractions
Quiz
•
3rd Grade
15 questions
Valentine's Day Trivia
Quiz
•
3rd Grade
20 questions
Main Idea and Details
Quiz
•
5th Grade
20 questions
Context Clues
Quiz
•
6th Grade
Discover more resources for Mathematics
25 questions
Multiplication Facts
Quiz
•
5th Grade
20 questions
Classifying Triangles
Quiz
•
5th Grade
10 questions
Multiplying Fractions
Quiz
•
5th Grade
20 questions
Writing Algebraic Expressions
Quiz
•
6th Grade
10 questions
Adding and Subtracting Decimals
Quiz
•
5th Grade
20 questions
Ratios/Rates and Unit Rates
Quiz
•
6th Grade
15 questions
Rounding Decimals
Quiz
•
5th Grade
16 questions
Volume of Rectangular Prisms and Cubes
Quiz
•
5th Grade