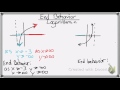
End Behavior of Graphs
Interactive Video
•
Mathematics
•
9th - 10th Grade
•
Practice Problem
•
Hard

Patricia Brown
FREE Resource
Read more
10 questions
Show all answers
1.
MULTIPLE CHOICE QUESTION
30 sec • 1 pt
What is the primary focus when determining the end behavior of logarithmic functions?
The thickness of the graph line
The behavior of x and y values
The shape of the graph
The color of the graph
2.
MULTIPLE CHOICE QUESTION
30 sec • 1 pt
As x approaches the asymptote on the left side of the first graph, what happens to the y values?
They oscillate
They remain constant
They approach negative infinity
They approach positive infinity
3.
MULTIPLE CHOICE QUESTION
30 sec • 1 pt
On the right side of the first graph, what is the behavior of x values?
They approach positive infinity
They oscillate
They remain constant
They approach negative infinity
4.
MULTIPLE CHOICE QUESTION
30 sec • 1 pt
What happens to the y values on the right side of the first graph as x approaches positive infinity?
They remain constant
They approach positive infinity
They oscillate
They approach negative infinity
5.
MULTIPLE CHOICE QUESTION
30 sec • 1 pt
On the left side of the second graph, what is the behavior of x values?
They approach positive infinity
They remain constant
They approach negative infinity
They oscillate
6.
MULTIPLE CHOICE QUESTION
30 sec • 1 pt
As x approaches negative infinity on the left side of the second graph, what happens to the y values?
They remain constant
They approach positive infinity
They approach negative infinity
They oscillate
7.
MULTIPLE CHOICE QUESTION
30 sec • 1 pt
On the right side of the second graph, what is the behavior of x values as they approach the asymptote?
They approach positive infinity
They remain constant
They approach negative infinity
They oscillate
Access all questions and much more by creating a free account
Create resources
Host any resource
Get auto-graded reports
Continue with Google

Continue with Email
Continue with Classlink
Continue with Clever
or continue with
Microsoft
%20(1).png)
Apple
Others
Already have an account?
