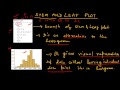
Understanding Stem-and-Leaf Plots
Interactive Video
•
Mathematics
•
9th - 10th Grade
•
Practice Problem
•
Hard

Patricia Brown
FREE Resource
Read more
10 questions
Show all answers
1.
MULTIPLE CHOICE QUESTION
30 sec • 1 pt
What are the two main components of a stem-and-leaf plot?
Root and branch
Leaf and branch
Stem and leaf
Stem and root
2.
MULTIPLE CHOICE QUESTION
30 sec • 1 pt
How does a stem-and-leaf plot differ from a histogram?
It retains individual data points
It does not show individual data points
It uses bars to represent data
It uses colors to represent data
3.
MULTIPLE CHOICE QUESTION
30 sec • 1 pt
What is the first step in constructing a stem-and-leaf plot?
Identify the smallest number
Sort the data in ascending order
Sort the data in descending order
Identify the largest number
4.
MULTIPLE CHOICE QUESTION
30 sec • 1 pt
In a stem-and-leaf plot, what do you do if a stem has no corresponding leaves?
Skip the stem
Add a placeholder leaf
Leave the stem empty
Remove the stem
5.
MULTIPLE CHOICE QUESTION
30 sec • 1 pt
What is the purpose of including all possible stems in a stem-and-leaf plot?
To confuse the reader
To make the plot look complete
To add more data points
To ensure no gaps in data representation
6.
MULTIPLE CHOICE QUESTION
30 sec • 1 pt
How can stem-and-leaf plots help in data analysis?
By showing the relative density of data
By hiding outliers
By simplifying data
By removing data points
7.
MULTIPLE CHOICE QUESTION
30 sec • 1 pt
What is one advantage of using a stem-and-leaf plot over a histogram?
It is easier to draw
It is more colorful
It provides a more detailed view of data
It uses less paper
Access all questions and much more by creating a free account
Create resources
Host any resource
Get auto-graded reports
Continue with Google

Continue with Email
Continue with Microsoft
or continue with

%20(1).png)
Apple
Others
Already have an account?
