Measures of Center in Statistics
Interactive Video
•
Mathematics
•
9th - 10th Grade
•
Practice Problem
•
Hard

Patricia Brown
FREE Resource
Read more
10 questions
Show all answers
1.
MULTIPLE CHOICE QUESTION
30 sec • 1 pt
What is an outlier in a data set?
A value that is very close to the mean
A value that is far from the center of the distribution
A value that is the same as the mode
A value that is always positive
2.
MULTIPLE CHOICE QUESTION
30 sec • 1 pt
Which of the following is NOT a measure of center?
Mean
Median
Mode
Range
3.
MULTIPLE CHOICE QUESTION
30 sec • 1 pt
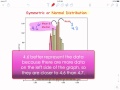
In a normal distribution, which measure of center is typically the best representation?
All of the above
Median
Mean
Mode
4.
MULTIPLE CHOICE QUESTION
30 sec • 1 pt
Why is the median preferred over the mean in skewed distributions?
The median is less affected by extreme values
The median is always larger than the mean
The median is easier to calculate
The median is the same as the mode
5.
MULTIPLE CHOICE QUESTION
30 sec • 1 pt
In which situation is the mode a better choice to represent the center of a data set?
When the data set has no extreme values
When the data set is skewed
When the data set has more than one mode
When the data set is normally distributed
6.
MULTIPLE CHOICE QUESTION
30 sec • 1 pt
What is a characteristic of a jumble up distribution?
It is symmetrical
It has a single mode
It has multiple modes
It has no gaps
7.
MULTIPLE CHOICE QUESTION
30 sec • 1 pt
When is the mean a better choice to represent the center of a data set?
When the data set has extreme values
When the data set is symmetrical
When the data set is skewed
When the data set has multiple modes
Access all questions and much more by creating a free account
Create resources
Host any resource
Get auto-graded reports
Continue with Google

Continue with Email
Continue with Microsoft
or continue with

%20(1).png)
Apple
Others
Already have an account?
