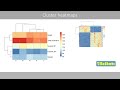
Gene Expression Heat Map Concepts
Interactive Video
•
Computers
•
10th - 12th Grade
•
Practice Problem
•
Hard

Patricia Brown
FREE Resource
Read more
10 questions
Show all answers
1.
MULTIPLE CHOICE QUESTION
30 sec • 1 pt
What is a heat map primarily used for?
To calculate statistical averages
To write programming code
To display data values as colors
To create 3D models
2.
MULTIPLE CHOICE QUESTION
30 sec • 1 pt
In a heat map, what color typically represents larger values?
Red or Orange
Yellow
Blue
Green
3.
MULTIPLE CHOICE QUESTION
30 sec • 1 pt
What is the purpose of a dendrogram in a cluster heat map?
To create a pie chart
To calculate the standard deviation
To show the hierarchical clustering of data
To display the mean of data
4.
MULTIPLE CHOICE QUESTION
30 sec • 1 pt
How does standardizing values affect a heat map?
It only changes the clustering
It changes the colors but not the clustering
It has no effect on the heat map
It alters both the colors and the clustering
5.
MULTIPLE CHOICE QUESTION
30 sec • 1 pt
What is the result of standardizing each column separately in a heat map?
The standard deviation becomes zero
The mean of the matrix becomes one
The order of columns changes
The dendrogram remains unchanged
6.
MULTIPLE CHOICE QUESTION
30 sec • 1 pt
Why is it more sensible to standardize variables instead of individual values?
To better represent relative differences among individuals
To make the heat map more colorful
To reduce the size of the data
To simplify the data entry process
7.
MULTIPLE CHOICE QUESTION
30 sec • 1 pt
In gene expression heat maps, what does a blue color indicate?
Higher expression than the mean
Average expression
No expression
Lower expression than the mean
Access all questions and much more by creating a free account
Create resources
Host any resource
Get auto-graded reports
Continue with Google

Continue with Email
Continue with Classlink
Continue with Clever
or continue with
Microsoft
%20(1).png)
Apple
Others
Already have an account?
Similar Resources on Wayground
Popular Resources on Wayground

15 questions
Fractions on a Number Line
Quiz
•
3rd Grade
20 questions
Equivalent Fractions
Quiz
•
3rd Grade
25 questions
Multiplication Facts
Quiz
•
5th Grade
29 questions
Alg. 1 Section 5.1 Coordinate Plane
Quiz
•
9th Grade
22 questions
fractions
Quiz
•
3rd Grade
11 questions
FOREST Effective communication
Lesson
•
KG
20 questions
Main Idea and Details
Quiz
•
5th Grade
20 questions
Context Clues
Quiz
•
6th Grade