Enthalpy Changes and Energy Diagrams
Interactive Video
•
Chemistry
•
9th - 10th Grade
•
Practice Problem
•
Hard

Patricia Brown
FREE Resource
Read more
10 questions
Show all answers
1.
MULTIPLE CHOICE QUESTION
30 sec • 1 pt
What is the standard enthalpy change of formation for ammonia gas?
+46 kJ/mol
-497 kJ/mol
-46 kJ/mol
+218 kJ/mol
2.
MULTIPLE CHOICE QUESTION
30 sec • 1 pt
Which of the following represents the enthalpy change of atomization for nitrogen?
N2(g) → N(g)
N2(g) → 2N(g)
1/2 N2(g) → N(g)
N(g) → 1/2 N2(g)
3.
MULTIPLE CHOICE QUESTION
30 sec • 1 pt
What is the enthalpy change of atomization for hydrogen?
+218 kJ/mol
+497 kJ/mol
+46 kJ/mol
+321 kJ/mol
4.
MULTIPLE CHOICE QUESTION
30 sec • 1 pt
In an energy level diagram, what is the energy level of elements in their standard state?
Variable energy
Negative energy
Positive energy
Zero energy
5.
MULTIPLE CHOICE QUESTION
30 sec • 1 pt
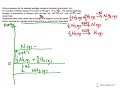
What is the bond energy of the NH bond in the context of the energy level diagram?
It is calculated using the enthalpy change of atomization.
It is determined by the difference in energy levels.
It is directly given as -46 kJ/mol.
It is calculated using the enthalpy change of formation.
6.
MULTIPLE CHOICE QUESTION
30 sec • 1 pt
How many NH bonds are present in NH3?
Two
Four
Three
One
7.
MULTIPLE CHOICE QUESTION
30 sec • 1 pt
What is the main difference between an energy level diagram and an energy cycle?
Energy cycles involve more complex calculations.
Energy level diagrams show the direction of energy flow.
Energy level diagrams use arrows to indicate energy changes.
Energy cycles are simpler to draw.
Access all questions and much more by creating a free account
Create resources
Host any resource
Get auto-graded reports
Continue with Google

Continue with Email
Continue with Classlink
Continue with Clever
or continue with
Microsoft
%20(1).png)
Apple
Others
Already have an account?
