Graph Analysis and Waste Management
Interactive Video
•
Mathematics
•
6th - 7th Grade
•
Practice Problem
•
Hard

Patricia Brown
FREE Resource
Read more
10 questions
Show all answers
1.
MULTIPLE CHOICE QUESTION
30 sec • 1 pt
What are the main objectives of today's session?
Understand the basics of programming
Learn about historical events
Explore different types of literature
Identify different types of graphs and analyze them
2.
MULTIPLE CHOICE QUESTION
30 sec • 1 pt
Which of the following is NOT a type of graph mentioned?
High growth graph
Pie chart
Bar graph
Line graph
3.
MULTIPLE CHOICE QUESTION
30 sec • 1 pt
What is the first step in analyzing a graph?
Draw a conclusion
Use suitable transitions
Mention the title of the graph
Observe the numbers and words
4.
MULTIPLE CHOICE QUESTION
30 sec • 1 pt
Which words are suggested for describing changes in numbers over years?
Add and subtract
Multiply and divide
Rise and fall
Increase and decrease
5.
MULTIPLE CHOICE QUESTION
30 sec • 1 pt
What is the importance of using suitable transitions in graph analysis?
To connect sentences smoothly
To make the analysis more colorful
To confuse the reader
To increase the length of the analysis
6.
MULTIPLE CHOICE QUESTION
30 sec • 1 pt
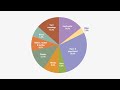
What percentage of solid waste is occupied by organic waste in the example?
50%
13%
17%
6%
7.
MULTIPLE CHOICE QUESTION
30 sec • 1 pt
Which type of waste occupies the lowest percentage in the example?
Metals
Glass
Plastics
Paper
Access all questions and much more by creating a free account
Create resources
Host any resource
Get auto-graded reports
Continue with Google

Continue with Email
Continue with Microsoft
or continue with

%20(1).png)
Apple
Others
Already have an account?
