Understanding Dot Plots in Statistics
Interactive Video
•
Mathematics
•
6th - 7th Grade
•
Practice Problem
•
Hard

Patricia Brown
FREE Resource
Read more
10 questions
Show all answers
1.
MULTIPLE CHOICE QUESTION
30 sec • 1 pt
What is the primary purpose of a dot plot in statistics?
To visualize the frequency distribution of data
To find the mode of a dataset
To calculate the mean of a dataset
To determine the median value
2.
MULTIPLE CHOICE QUESTION
30 sec • 1 pt
What is the first step in creating a dot plot?
Identify the median value
Draw a vertical line
Find the lowest and highest values
Calculate the average
3.
MULTIPLE CHOICE QUESTION
30 sec • 1 pt
What is the significance of the horizontal line in a dot plot?
It indicates the mode of the dataset
It shows the range of the data
It represents the median of the data
It is used to plot the data values
4.
MULTIPLE CHOICE QUESTION
30 sec • 1 pt
How do you represent a data value that appears multiple times in a dot plot?
By using different colors
By placing dots above one another
By increasing the size of the dot
By using a different shape
5.
MULTIPLE CHOICE QUESTION
30 sec • 1 pt
What should you do if a data value occurs more than once in a dot plot?
Increase the size of the dot
Place the dots side by side
Use a different color for each occurrence
Stack the dots vertically
6.
MULTIPLE CHOICE QUESTION
30 sec • 1 pt
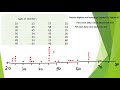
In the example of teachers' ages, what is the range of ages used for the dot plot?
23 to 65
10 to 100
30 to 70
20 to 80
7.
MULTIPLE CHOICE QUESTION
30 sec • 1 pt
What is the first data point plotted in the teachers' ages example?
30
56
25
45
Access all questions and much more by creating a free account
Create resources
Host any resource
Get auto-graded reports
Continue with Google

Continue with Email
Continue with Classlink
Continue with Clever
or continue with
Microsoft
%20(1).png)
Apple
Others
Already have an account?
Popular Resources on Wayground

15 questions
Fractions on a Number Line
Quiz
•
3rd Grade
10 questions
Probability Practice
Quiz
•
4th Grade
15 questions
Probability on Number LIne
Quiz
•
4th Grade
20 questions
Equivalent Fractions
Quiz
•
3rd Grade
25 questions
Multiplication Facts
Quiz
•
5th Grade
22 questions
fractions
Quiz
•
3rd Grade
6 questions
Appropriate Chromebook Usage
Lesson
•
7th Grade
10 questions
Greek Bases tele and phon
Quiz
•
6th - 8th Grade
Discover more resources for Mathematics
20 questions
Writing Algebraic Expressions
Quiz
•
6th Grade
20 questions
Ratios/Rates and Unit Rates
Quiz
•
6th Grade
14 questions
Volume of rectangular prisms
Quiz
•
7th Grade
15 questions
Graphing Inequalities
Quiz
•
7th - 9th Grade
20 questions
Graphing Inequalities on a Number Line
Quiz
•
6th - 9th Grade
20 questions
One Step Equations
Quiz
•
6th Grade
12 questions
One-Step Equations
Quiz
•
6th Grade
6 questions
Equations from models
Quiz
•
6th Grade