Direct Proportionality Concepts
Interactive Video
•
Mathematics
•
6th - 7th Grade
•
Practice Problem
•
Hard

Thomas White
FREE Resource
Read more
10 questions
Show all answers
1.
MULTIPLE CHOICE QUESTION
30 sec • 1 pt
What does it mean when two variables are directly proportional?
One variable increases while the other decreases.
Both variables increase or decrease at the same rate.
Both variables decrease at different rates.
One variable remains constant while the other changes.
2.
MULTIPLE CHOICE QUESTION
30 sec • 1 pt
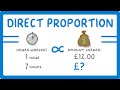
In the example of hours worked and money earned, what symbol is used to show direct proportionality?
Multiplication sign
Greater than sign
Equal sign
Proportional symbol
3.
MULTIPLE CHOICE QUESTION
30 sec • 1 pt
If you work 5 hours and earn 60 pounds, how much would you earn if you worked 10 hours?
120 pounds
90 pounds
60 pounds
30 pounds
4.
MULTIPLE CHOICE QUESTION
30 sec • 1 pt
What is a key feature of a graph representing direct proportionality?
It is a curved line.
It passes through the origin.
It has multiple peaks.
It is a horizontal line.
5.
MULTIPLE CHOICE QUESTION
30 sec • 1 pt
On a graph of direct proportionality, what does the point (0,0) represent?
The maximum value of the variables.
The starting point of the graph.
The point where both variables are zero.
The midpoint of the graph.
6.
MULTIPLE CHOICE QUESTION
30 sec • 1 pt
How much would you earn if you worked 3.5 hours, according to the graph example?
24 pounds
35 pounds
12 pounds
42 pounds
7.
MULTIPLE CHOICE QUESTION
30 sec • 1 pt
What is the main takeaway about the relationship between two directly proportional variables?
They have no relationship.
One remains constant while the other changes.
They increase or decrease independently.
They increase or decrease proportionally.
Access all questions and much more by creating a free account
Create resources
Host any resource
Get auto-graded reports
Continue with Google

Continue with Email
Continue with Microsoft
or continue with

%20(1).png)
Apple
Others
Already have an account?
